Figures & data
Figure 1. The schematic map of the proviral BLV DNA (GeneBank: KT122858.1) and locations of BLV-MIRS-F and BLV-MIRS-B oligonucleotides. Genes encoding proteins are shown in green, and genes encoding RNAs are shown in blue. Thick lines indicate exons, and thin lines represent introns.
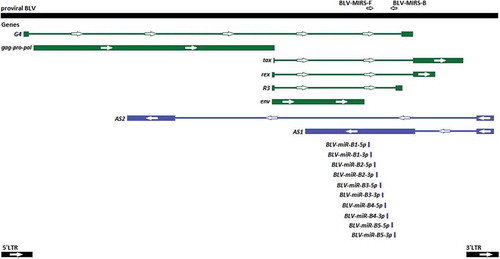
Table 1. (a). Nucleotide sequences of BLV pre-miR-B alleles. (b). Nucleotide sequences of pre-miR-B alleles and their frequencies of the occurrence in each subgroup (I-st and II-nd) of BLV-positive cows. The significance level of P values is indicated by color: purple – not significant (P pre-miR-B1 = 0.21), pink – highly significant (Ppre-miR-B2 = 0.15 × 10⁻¹², Ppre-miR-B3 = 0.50 × 10⁻¹⁰, Ppre-miR-B4 = 0.59 × 10⁻¹⁵, Ppre-miR-B5 = 0.78 × 10⁻⁹). Pre-miR-B alleles highlighted in green have been considered as contributed to a decrease of WBC counts. Pre-miR-B alleles do not highlight have been considered as contributed to increasing of WBC counts. Pre-miR-B alleles identified in both subgroups have been highlighted in yellow. Loop sequences of pre-miRs-B have been underlined.
Table 2. Unpaired t-test results for groups and subgroups of cows.
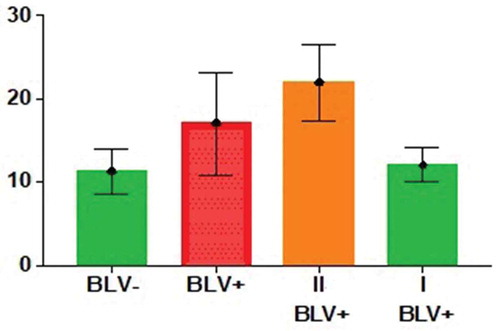
Figure 2. Two-way ANOVA test results for BLV-negative, BLV-, (N = 26) and all BLV-positive, BLV+, (N = 16) groups of cows, and for BLV-positive, I-st BLV+, (N = 8) and II-nd BLV+ (N = 8) subgroups of cows. The number of WBCs (y ˣ 103cells/µL) is on the y-axis.