Figures & data
Figure 1. Identification of SMRG as a lncRNA.
(a)Schematic diagram of the SMRG locus and strategy for the generation of SMRG and DTIS11 mutants. The primers used to identify SMRG by RT-PCR and check the identity of the SMRGM mutant by PCR and qPCR, the predicted EST region, the probe used for northern blotting, and the deleted DNA region in SMRGM are shown. The protospacer adjacent motif (PAM) sequences are marked in red. The gRNA binding sequences are underlined. Scissors indicate where the Cas9 cleaves at the DTIS11 and SMRG loci. Red dots represent the 2-bp deletion in the DTIS11 genomic sequence. (b) Exact expression of SMRG in WT CS, flies. M, DNA marker. P, positive control, amplified from genomic DNA. N, negative control, amplified without cDNA template. (c) 5′ and 3′ RACE of SMRG in WT CS fly. (d) Northern blotting of SMRG in WT CS and SMRGM flies. A ~ 1.9-kb SMRG transcript (arrow) was observed in the adult whole fly of the WT CS, but not in the whole fly of the SMRGM flies. M, RNA marker. (e) In vitro translation assay for SMRG. M1, low-range protein ladder. M2, high-range protein ladder. N, negative control, containing no DNA template to show the background. P, positive control, expressing biotinylated luciferase. SMRG, SMRG cloned downstream of the T7 promoter expressed in the in vitro translation system.
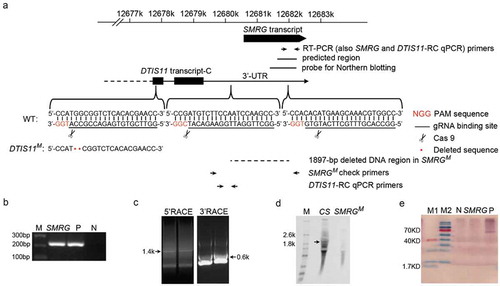
Figure 2. Distribution of SMRG in three body parts of WT adult fly.
SMRG showed the highest expression level in adult head and thorax, and very low expression in the abdomen. For DTIS11-RC+SMRG transcript, comparison of head versus thorax, t(20.95) = 1.89, p = 0.0727, For DTIS11-RC transcript, comparison of head versus thorax, t(18.24) = 3.94, p = 0.0009, For SMRG transcript, comparison of head versus thorax, t(30) = −1.205, p = 0.2376, *** p < 0.001; n.s., not significant. Error bars indicate the SEM (Independent-Samples T test).
Figure 3. SMRG is required for regulating scutellar macrochaetes.
(a) Identification of SMRGM. PCR was performed using genomic DNA from CS and SMRGM flies with primers flanking the deficiency region in SMRGM. The fragment amplified from SMRGM was 532-bp in length, 1897-bp shorter than the ~2.4-kb product from the WT control. (b) The levels of expression of both SMRG and DTIS11-RC were measured by qPCR, both of which were abolished in SMRGM, p≪0.001 (Mann-Whitney U test). (c) The expression level of DTIS11-RC was measured by qPCR, which was abolished in SMRGM, p≪0.001 (Mann-Whitney U test). (d) Extra scutellar macrochaetes were observed in SMRGM (white arrows). (e) Quantification of the number of scutellar macrochaetes in SMRGM, DTIS11M, and CS flies. Comparison of CS versus SMRGM, t(153.63) = −12.255, p≪0.001, Comparison of CS versus DTIS11M, t(131.50) = −1.934, p = 0.0553. (Independent-Samples T test). (f) The supernumerary scutellar macrochaetes of SMRGM were rescued by the overexpression of SMRG driven by two proneural Gal4s, Comparison of group1 versus 2, t(86.591) = −3.557, p = 0.0006, Comparison of group1 versus 3, t(260.428) = −6.043, p≪0.001, Comparison of group 3 versus 5, t(214) = 6.755, p≪0.001, Comparison of group 4 versus 5, t(196) = 6.325, p≪0.001 (Independent-Samples T test). ***p < 0.001; n.s., not significant. Error bars indicate the SEM. The number of adult flies with each genotype is shown in parentheses.
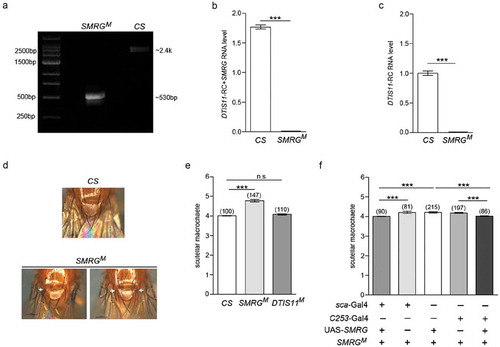
Figure 4. SMRG regulates scutellar macrochaetes by antagonizing sc.
(a) The sc RNA level in the thorax was higher in SMRGM than in CS flies, t(21.77) = −6.268, p≪0.001 (Independent-Samples T test). (b) The supernumerary scutellar macrochaetes in heterozygous SMRGM were rescued in the double-heterozygous for SMRGM and sc mutants, comparison of group 3 versus 4, t(161.6) = 7.242, p≪0.001, comparison of group 3 versus 5, t(184.53) = 6.502, p≪0.001 (Independent-Samples T test). (c) The phenotype of supernumerary scutellar macrochaetes in homozygous SMRGM was intensified by sc overexpression driven by sca-Gal4, comparison of group 1 versus 3, t(205.42) = −8.603, p≪0.001, comparison of group 2 versus 3, t(183.348) = −16.422, p≪0.001 (Independent-Samples T test). ***p < 0.001. Error bars indicate the SEM. The number of adult flies with each genotype is shown in parentheses.
Figure 5. E(spl)mβ also regulates scutellar macrochaetes by antagonizing sc.
(a) Schematic diagram of the E(spl)mβ locus and strategy of the generation of its mutant. The PAM sequence is marked in red. The gRNA binding sequence is underlined. Scissors indicate where Cas9 cleaves at the E(spl)mβ locus. Red dots represent the 7-bp deletion in the E(spl)mβ genomic sequence. (b) Quantification of the number of scutellar macrochaetes in E(spl)mβ12−11 and CS flies, t(172.112) = −9.972, p≪0.001 (Independent-Samples T test). (c) The sc RNA level in the thorax of E(spl)mβ12−11 was higher than in CS flies, t(19.622) = −12.748, p≪0.001 (Independent-Samples T test). (d) The supernumerary scutellar macrochaetes in heterozygous E(spl)mβ12−11 were restored in the double-heterozygous for E(spl)mβ12−11 and sc mutants, comparison of group 3 versus 4, p≪0.001 (Mann-Whitney U test), comparison of group 3 versus 5, t(151.374) = 7.176, p≪0.001 (Independent-Samples T test). (e) The phenotype of supernumerary scutellar macrochaetes in homozygous E(spl)mβ12−11 was intensified by sc overexpression driven by sca-Gal4, comparison of group 1 versus 3, t(228.729) = −15.332, p≪0.001, comparison of group 2 versus 3, t(213.259) = −16.626, p≪0.001, (Independent-Samples T test). ***p < 0.001. Error bars indicate the SEM. The number of adult flies with each genotype is shown in parentheses.
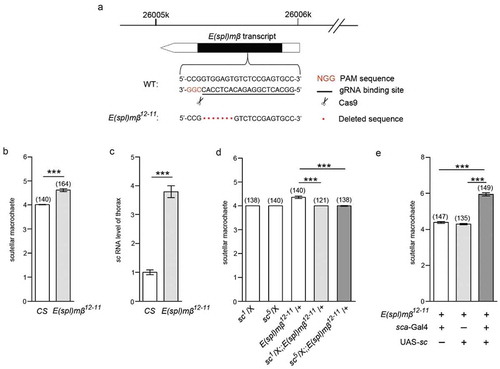
Figure 6. SMRG negatively regulates sc promoter by promoting the occupancy of E(spl)mβ repressor.
(a) Schematic diagram of the sc gene showing the transcription start site (arrow). The detected occupancy sites CHIP1-7 within the potential sc promoter region are shown. (b, c) Introduction of the sc 1.7kb-up fragment into the pGL3-Basic luciferase reporter plasmid induced luciferase expression, suggesting that it contains the sc promoter region. Additional expression of the SMRG, comparison of group 1 versus 2, t(2.16) = −63.542, p = 0.000142, comparison of group 2 versus 3, t(4) = 34.395, p≪0.001 (b) or E(spl)mβ, comparison of group 1 versus 2, t(4) = −13.418, p = 0.000178, comparison of group 2 versus 3, t(2.01) = 11.492, p = 0.00735 (c) transcript in pcDNA3.1 inhibited the sc 1.7 kb-up-induced luciferase expression (Independent-Samples T test). (D) In vivo occupancy of E(spl)mβ on the sc promoter (CHIP7) was decreased in SMRGM flies, indicating that such occupancy is positively regulated by the SMRG transcript, t(21.389) = 15.844, p≪0.001 (Independent-Samples T test). **p < 0.01,***p < 0.001. Error bars indicate the SEM.
Figure 7. SMRG regions associated with E(spl)mβ were identified.
(a) Schematic representation of the SMRG gene showing the transcription start site (arrow). All of the detected truncated coprecipitated SMRG fragments are shown. (b-d), In vivo identification of the SMRG transcript fragments (RIP4-RIP6) associated with E(spl)mβ. M, DNA marker. +RT, reverse transcription. -RT, control for DNA contamination. (e-g), Quantification of the association of RIP4-RIP6 with E(spl)mβ, t(24.602) = −7.714, p≪0.001 (e), t(26) = −7.078, p≪0.001 (f), t(21.067) = −8.391, p≪0.001(G) (Independent- Samples T test). ***p < 0.001. Error bars indicate the SEM.
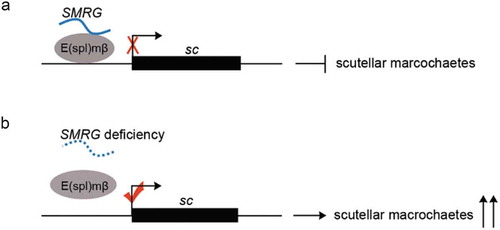
Figure 8. Model for SMRG function in scutellar macrochaetes.
(a) SMRG recruits the repressor of E(spl)mβ to the sc promoter region, thereby negatively regulating sc expression and subsequent emergence of scutellar macrochaetes. (b) While SMRG deficiency causes low occupancy of E(spl)mβ on the sc promoter region, which in turn derepresses sc expression and promotes responsive supernumerary scutellar macrochaetes.