Figures & data
Table 1. 5′ and 3′ termini of the steady-state transcripts in maize NB mitochondria.
Figure 1. Mapping of representative mature RNAs with primary 5′ ends. (A) Gel separation of cRT-PCR products. + and -: samples treated and non-treated by RNA 5′-polyphosphatase, respectively. The two samples were normalized by amplification of 26S rRNA (26S) using outward-facing primers. The bands as indicated were sequenced by cloning into vectors. M: DNA molecular marker. (B) RT-qPCR analysis of the relative abundance of circularized primary transcripts after the treatment by 5′-polyphosphatase. n4: nad4-1, a8: atp8-1, cb: cob. +/-: nad4-1, atp8-1, or cob over 26S in the treated sample/nad4-1, atp8-1, or cob over 26S in the non-treated sample, respectively. The values are mean and SD of three biological replicates. (C) RNA gel blot assay of nad4, atp8, and cob transcripts. 2 µg mitochondrial RNAs were loaded in each lane. Bands corresponding to full-length mRNAs revealed by cRT-PCR are marked. n4, a8 and cb: RNA probes derived from coding regions of nad4, atp8, and cob genes, respectively. (D) Transcript termini deduced from cRT-PCR clones. Gene coding regions are shown as gray boxes, and 5′ and 3′ UTRs as bold lines. Positions of 5′ and 3′ ends relative to translation start codon AUG (+1) and stop codon UGA, UAA, or UAG (−1), and numbers of clones obtained at those positions are indicated. Positions of primers used for reverse transcription and PCR amplification are indicated by closed and open arrows, respectively. Positions of outward-facing primers used for RT-qPCR are indicated by open squares. Positions of RNA probes are as indicated. Scale bar = 100 nts.
Figure 2. Sequence analysis of the regions 20 nts upstream of transcription initiation sites. (A) Primary 5′ ends downstream of putative promoter core elements CRTA (R = A and G). Putative promoters are named as P-transcript name-distance between transcription initiating site and AUG (mature mRNAs) or the downstream exon (nad1T3), and P is short for Promoter; transcription initiating nucleotides are underlined, and putative promoter cores are written in bold; the number of molecules obtained at each initiation site together with the total number of clones sequenced for the recovered band are given. (B) MEME analysis discovered a 7-nt-long promoter motif upstream of 126 transcription initiation sites (for both mature and precursor RNAs). This motif is characterized by presence of a core element crTA (uppercase letters depict overrepresented nucleotide >1 bit).
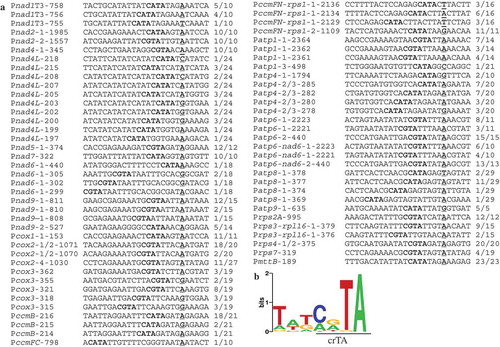
Figure 3. Mapping of representative mature RNAs with processed 5′ ends. (A) Gel separation of cRT-PCR products. + and -: samples treated and non-treated by RNA 5′-polyphosphatase, respectively. The two samples were normalized by amplification of 26S rRNA (26S) using outward-facing primers. The bands as indicated were sequenced by cloning into vectors. n3: nad3, r12: rps12, 18S: 18S rRNA. M: DNA molecular marker. (B) RT-qPCR analysis of the relative levels of circularized processed transcripts after the treatment by 5′-polyphosphatase. +/-: nad3-rps12 or 18S over 26S in the treated sample/nad3-rps12 or 18S over 26S in the non-treated sample. The values are mean and SD of three biological replicates. (C) RNA gel blot assay of nad3-rps12 and 18S rRNA. 2 µg mitochondrial RNAs were loaded in each lane. Bands corresponding to mature RNAs revealed by cRT-PCR are marked. n3, r12 and 18S: RNA probes derived from coding regions of nad3, rps12 and rrn18 genes, respectively. (D) Transcript termini deduced from cRT-PCR clones. For nad3-rps12, the gene coding regions are shown as gray boxes, and 5′ and 3′ UTRs as bold lines; the mature 18S rRNA is shown as a black box. 5′ and 3′ ends of nad3-rps12 relative to nad3 AUG (+1) and rps12 UGA (−1) and the transcript termini of 18S rRNA in maize NB mitochondrial genome are indicated. Positions of primers used for reverse transcription and PCR amplification are indicated by closed and open arrows, respectively. Positions of outward-facing primers used for RT-qPCR are indicated by open squares. Positions of RNA probes are as indicated. Scale bar = 100 nts.
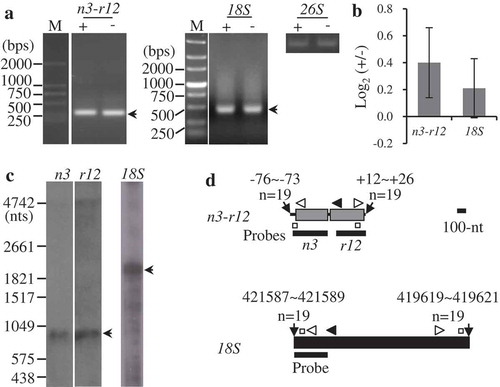
Figure 4. tRNAs and t-elements adjacent to the mapped transcript termini. Positions of transcript termini relative to the neighboring exons are indicated. tRNAs and t-elements are predicted by tRNAscan-SE and Mfold, respectively.
Table 2. Non-encoded nucleotides detected at 5ʹ→3ʹ junctions.
Figure 5. Mapping of nad5 precursors. (A) Gel separation of nad15T1, nad5T2, and nad5T3 cRT-PCR products. + and -: samples treated and non-treated by RNA 5′-polyphosphatase, respectively. The two samples were normalized by amplification of 26S rRNA (26S) using outward-facing primers. The bands as indicated were sequenced by cloning into vectors. M: DNA molecular marker. (B) Transcript termini of nad15T1, nad5T2, and nad5T3 deduced from cRT-PCR clones. Exons are shown as gray boxes, and 5′ and 3′ termini as bold lines. Positions of 5′ and 3′ ends in respect to the neighboring exons, and numbers of clones obtained at those positions are indicated. Positions of primers used for reverse transcription and PCR amplification are indicated by closed and open arrows, respectively. ex and int: exon and intron, respectively. Scale bar = 100 nts.
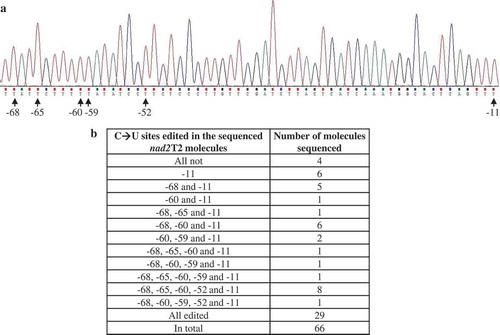
Figure 6. C→U RNA editing at nad2T2. (A) The six C→U editing sites identified at nad2 exon 5. Positions of the editing sites relative to nad2 UAA (−1) are indicated. All six sites are fully edited in the forty nad2 molecules analyzed. (B) Editing of the six C→U sites in nad1T4 precursor. Among the sixty-six nad2T2 molecules analyzed, twenty-nine were fully edited, four were not edited, and the other thirty-three were partially edited.