Figures & data
Figure 1. Depletion of T. brucei RRP44 by inducible RNA interference. (a) Effects on cell growth. T. brucei cells transfected with vector p2T7-177–RRP44 were growth in the presence (circles) or absence (filled squares) of tetracycline. Non-transfected cells in the presence of tetracycline (open squares) were also used as control. Cultures were diluted to 106 cells after 48 hours for the next time points. (b) Analysis of the level of TbRRP44 mRNA by quantitative RT-PCR normalized to GAPDH. Error bars indicate standard deviation of triplicate experiments. (c) Decreasing of RRP44 protein detected on a western blot using polyclonal antiserum at different time-points after RNAi induction.
Figure 2. Polysomal profile analysis. Cell extracts were submitted to velocity sedimentation on 15 to 55% sucrose gradients. (a) Control (left) and induced TbRRP44 RNAi cells (right) at 48 hours post induction. (b) Control (left) and induced TbRRP44 RNAi cells (right) at 72 hours post induction. 5.8 × 10⁸ and 2.5 × 10⁸ cells were used for the polysomes analysis at 48 and 72 hours post induction, respectively. The experiments were performed at least twice with consistent results.
Figure 3. Depletion of T. brucei RRP44 impairs cleavage steps related to the LSU rRNA maturation. The relative change in the target amplicons was determined by quantitative RT-PCR analysis of total RNA and normalized to the GAPDH mRNA. Control cells (black bars, normalized to 1), cells 48 h post RNAi induction (dark grey bars) and cells 72 h post RNAi induction (light grey bars). Error bars indicate standard deviation of triplicate experiments. At the bottom, a schematic representation of the rRNA precursor, indicating the amplicons analyzed in this work (black dashes).
Figure 4. Accumulation of LSU rRNA precursors in TbRRP44 knockdown cells as revealed by Northern blot analysis. (a) Total RNA was extracted at 0, 24, 48, 72 and 96 hours after induction of RNAi for TbRRP44 depletion and analyzed by Northern hybridization with fluorescently labelled oligonucleotides complimentary to the regions of the T. brucei pre-rRNA corresponding to the 5.8S rRNA (left panel), to the 5.8S rRNA-ITS2 junction (central panel) and to the ITS3 (right panel). The positions of the precursors as wells as of the 5.8S rRNA are indicated on the right-hand side of each panel. (b) Schematic organization of the 9.2 kb precursor of T. brucei ribosomal RNA with the intermediates identified by Northern blotting. Dashed box,18S/SSU rRNA; grey boxes LSU rRNA segments; ETS, external transcribed spacers; ITS internal transcribed spacers; SR, small RNA; * indicates an additional band that might correspond to LSU1 due to the relatively low stringency of the hybridization conditions as probe ITS3 contains 11 nucleotides complementary to the region of LSU1. The three probes reveal accumulation of the 5.8 kb precursor comprising the regions of the seven rRNA segments that form the mature large subunit. In addition, the probes 5.8S rRNA and 5.8S rRNA-ITS2 junction reveal accumulation of the 0.61 kb segment, which corresponds to the 7S pre-rRNA comprising the 5.8S with part of ITS2. The probe that hybridizes in ITS3 reveals also accumulation of the 5.0 kb and 3.9 kb precursors of the large subunit rRNAs.
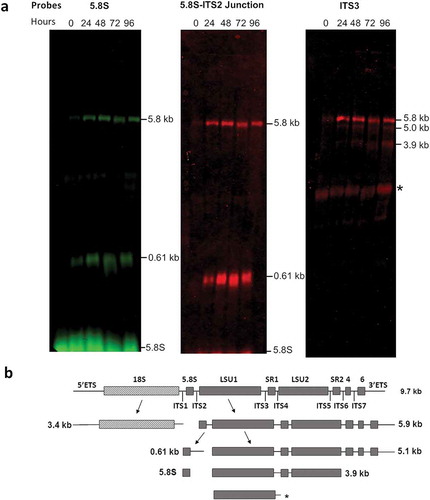
Table 1. Crystallographic data and refinement statistics. Values in parentheses are for the highest resolution shell.
Figure 5. TbRRP44 endonucleolytic site. (a) Superposition of TbRRP44 (orange) and ScRrp44 (blue, PDB 5K36) structures. TbRRP44 catalytic residues and the corresponding residues in ScRrp44 are shown in sticks and labeled. The residues forming the neighboring Zn interaction site in TbRRP44 (H69, N70 and H175) are also shown. The Mn ions bound to the TbRRP44 active site are represented as purple spheres while the Zn atom is shown in light grey. (b) Detail of the interactions involving the manganese ions. Water molecules are represented as red spheres. TbRRP44 catalytic residues and main chain (MC) atoms involved in the interactions are identified.
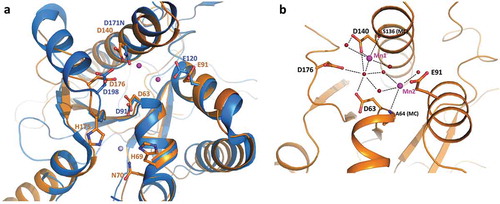
Figure 6. Superposition of TbRRP44-NPIN and ScRrp44 structures in two functional conformations. TbRRP44-NPIN is shown in orange. The ScRrp44 coordinates are from PDB 5K36 and 4IFD, corresponding to the direct route (a) and channel route (b) conformations, respectively. ScRrp44 is colored by domain. NPIN is shown in blue. CSD, RNB and S1 domains are represented in light pink, magenta and dark purple, respectively. TbRRP44 helix α6 and ScRrp44 Pro226 are indicated.
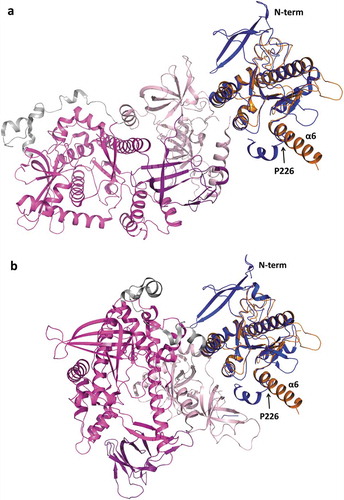
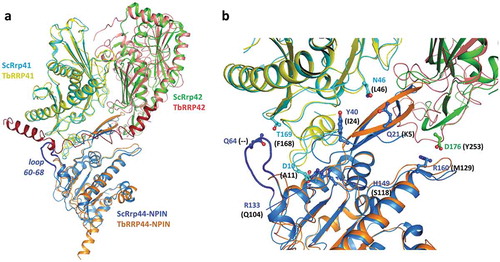
Figure 7. Superposition of TbRRP44-NPIN, TbRRP41 and TbRRP41 models and the yeast exosome subunits counterparts ScRrp44 (NPIN domain), ScRrp41 and ScRrp42 (PDB 4IFD, channel route conformation). (a) Overall structure of the assembly. The proteins are identified with different colors. The loop formed by residues 60–68 in ScRrp44 is highlighted in dark blue. TbRRP42 C-terminal extension (dark red) collides with TbRRP44-NPIN according to the structural prediction. (b) Detail of the subunits interface. TbRRP42 C-terminal was omitted for clarity. ScRrp44 side chains involved in intermolecular hydrogen bonds and salt bridges which are not conserved in TbRRP44-NPIN are shown in sticks and labeled. Substitutions in TbRRP44 are indicated in parenthesis.