Figures & data
Figure 1. Western blot and representative TEM images for the subcellular fractions of HepG2 cells and Immunogold electron microscopy images showing the localization of exosomes. (a) Western blot analysis of the purified subcellular fractions. The six purified subcellular fractions of HepG2 cells were verified by western blot analysis using specific detection antibodies (Lamin A: nuclear marker; AKR1B1 and tubulin: cytoplasm marker; UQCRC1 and VDAC1: mitochondria marker; LAMP1 and CD63: exosome marker; RPS5 and RPL24: ribosome marker). (b) Representative TEM images of the purified subcellular fractions (Scale bar: 1 µm for the nucleus, 100 nm for all others). (c) The first TEM image shows the localization of exosomes derived from HepG2 cells as controls. The other three TEM images show the localization of exosomes by TEM coupled to immunogold labeling of CD9, CD63 and Hsp70. The arrows indicate the golden particles.
Figure 2. Comparative transcriptome analysis of circRNAs among the subcellular fractions. (a) CircRNA expression profile among the subcellular fractions. The number of circRNAs expressed at various cutoff expression levels is represented by the indicated colors. (b) Correlation matrix of the circRNA expression among the fractions. The size and color intensity of red circles indicate the relative strength of the correlation between the fractions.
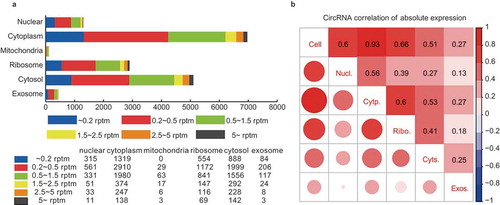
Figure 3. Validation of subcellular localization of circRNAs by Nanostring nCounter technology and RNA FISH. (a) Schematic diagram showing circRNA validation based on Nanostring nCounter technology. The ‘nCounter ElementsTM Reagents’ include Probe A, Probe B, Reporter Tag and Capture Tag (shown in the box). Probe A and Probe B are designed to specifically recognize the flanking exonic sequences of targeted circRNA junction points. The Reporter and Capture Tags are designed to bind Probe A and Probe B, respectively. (1) The reaction mixture (containing ‘nCounter ElementsTM Reagents’ and the target RNAs) were first hybridized at 65°C overnight. (2) The Capture Tag anchors the hybrid duplexes to the streptavidin-modified surface of the nCounter cartridge. After repeated washes, the anchored fluorescent barcodes on the cartridge can be used to measure the target-circRNA abundance. (b) Pair-wise comparison of subcellular exonic circRNA expression between RNA-seq (left panel) and nCounter analysis results (right panel). Nucl./Cytp.: the circRNAs preferentially expressed in the nucleus versus the cytoplasm (shown as salmon pink and green bars, respectively); Cytp./Nucl.: the circRNAs preferentially expressed in the cytoplasm versus the nucleus (shown as green and salmon pink bars, respectively); Ribo./Cyts.: the circRNAs preferentially expressed in the ribosome versus the cytosol (shown as blue and purple bars, respectively); Cyts./Ribo.: the circRNAs preferentially expressed in the cytosol versus the ribosome (shown as purple and blue bars, respectively). (c) Subcellular localization images of circRNAs using quantum dot FISH (scale bar: 25 μm). Here we selected three circRNAs (circGUSBP1, circNAB1, and circMGAT4A) that were highly expressed specifically in the nucleus, cytoplasm and ribosome, respectively. These were detected by the Qdot 585 probe FISH (shown as red dots). The nucleus, cytoplasm and ribosome are stained with DAPI (blue), and antibodies against Tubulin (green) and RPL24 (green), respectively.
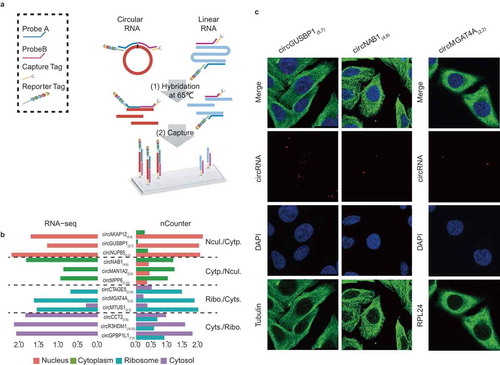
Figure 4. Subcelluar circRNA classification based on the two back-splicing positions (start and end) in the genome. (a) CircRNA classification according to the start and end genomic positions (five types: exonic, intronic, atypical exonic, overlap and intergenic types). The red and blue boxes represent the circRNAs and corresponding parental genes, respectively. (b) The proportions of five types of circRNA expressed in the six subcellular fractions. Each type of circRNA is represented by the indicated color box.
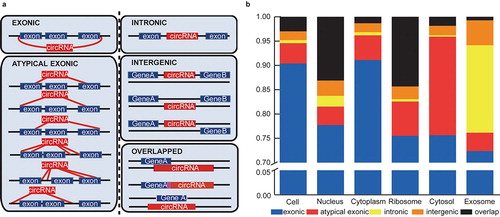
Figure 5. The length and GC content of the subcellular circRNAs. (a) Bar chart showing the length of exonic circRNAs in the six subcellular fractions. (b) Bar chart showing the GC content of exonic circRNAs in the six subcellular fractions.
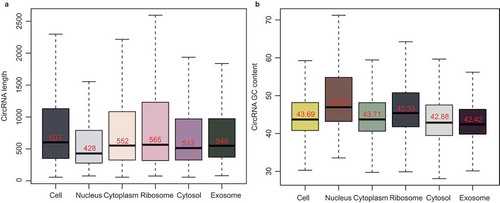
Figure 6. Forty-five isogenous circRNAs derived from the BIRC6 gene. (a) Schematic diagram showing the 45 isogenous circRNAs derived from BIRC6 gene. Forty-three isogenous circRNAs were identified in the RNA-seq analysis. Among them, 36 circRNAs were validated by PCR (described as ‘CircRNAs identified by RNA-seq and PCR’); Seven circRNAs failed to be validated by PCR (described as ‘CircRNAs only identified by RNA-seq’). Two circRNAs were only verified by PCR (described as “CircRNAs only identified by PCR). The colored lines indicate the start and end positions of the circRNAs in the gene. (b) Schematic diagram showing the bridged and divergent primer amplification strategies. The bridged primer is shown to span the exon junctions, so as to only amplify and verify the circRNAs using cDNA templates. The divergent primers are shown to amplify the back-splicing exon junction regions of circRNA; the convergent primers are shown to amplify the exon regions as controls. (c) PCR verification of 38 BIRC6 isogenous circRNAs using bridged and divergent primer amplification strategies. Thirty-two circRNAs were validated by the ‘bridged primer amplification strategy’ using cDNA templates; as controls, the PCR products were not amplified from gDNA and LDNA (the complementary DNA reverse transcribed using oligo dT primers). Among them, 30 circRNAs were also identified by RNA-seq analysis; two circRNAs were novel. Six circRNAs were validated by the ‘divergent primer amplification strategy’. Convergent primers were used to amplify exon 2 as controls.
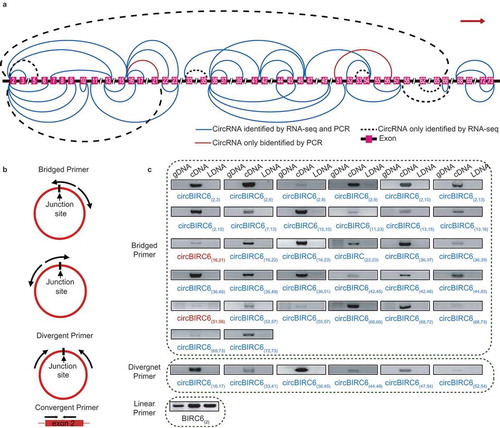
Figure 7. Isogenous circRNAs. (a) Percentage bar charts showing the expression distribution of the ISO circRNAs in six fractions. The ISO circRNA numbers are represented by the indicated colors. (b) Comparison of GC content distribution between the single circRNAs (purple) and ISO circRNAs (blue). The P-values are shown at the top of the box. (c) Comparison of length distribution between the single circRNAs (pink) and ISO circRNAs (green). The P-values are shown at the top of the box.
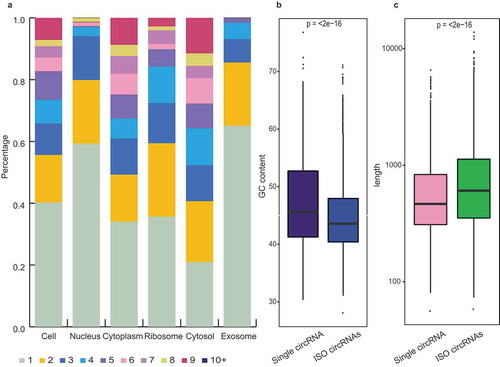
Figure 8. Binding motif analysis of the subcellular circRNAs. (a) Enrichment comparison of the 29 binding motifs of 19 nuclear export RBPs in cytoplasmic (blue) and nuclear circRNAs (green). P-values are shown at the top of the box. (b) Enrichment comparison of the Kozak sequence between ribosomal (carmine) and cytosol (yellow) circRNAs. The p-value are shown at the top of the box. (c) The sequence logo for the preferred motifs of exosomal circRNAs predicted from our data (left panel) and Huang’s RNA-seq data (right panel).
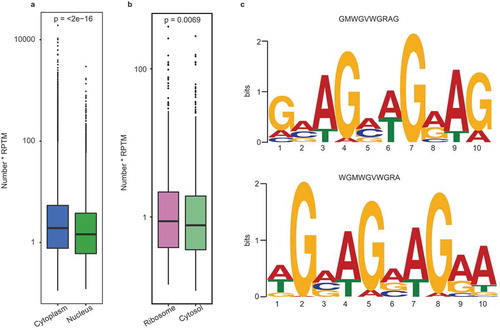
Table 1. Characteristics of the circRNAs among the fractions.
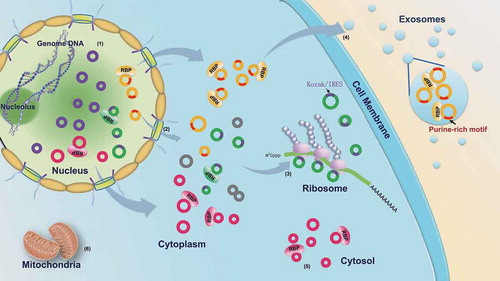
Figure 9. RBP-mediated transportation of circRNAs among the subcellular fractions. (1) The circRNAs are generated in the nucleus via the back-splicing reaction. (2) The majority of circRNAs are recognized by nuclear export-related RBPs and transported into the cytoplasm; the others without the RBP binding motifs are retained in the nucleus by negative selection. (3) The cytoplasmic circRNAs with Kozak or IRES sequences are specifically adsorbed by the ribosome. (4) The cytoplasmic circRNAs with a purine-rich motif (5ʹ-GMWGVWGRAG-3ʹ) may be recognized by some RBPs and packaged into the exosome. (5) The other cytoplasmic circRNAs are retained in the cytosol by the negative selection. (6) The circRNAs cannot enter the mitochondria. The purple circles represent the circRNAs retained in the nucleus. The green circles represent the circRNAs adsorbed in the ribosome; the purple arcs on the green circles represent the Kozak or IRES sequences. The yellow circles represent the circRNAs packaged into the exosome; the red arcs on the yellow circles represent the purine-rich motif. The pink circles represent the circRNAs accumulated in the cytosol fraction.