
Figures & data
Figure 1. Secondary structures of SR1 and ahrC483 mRNA.
Secondary structures of SR1 (a) and ahrC mRNA (b) as determined before [Citation8] are shown. GGA motifs are highlighted in black and numbered. Complementary regions A to G in SR1 and A’ to G’ in ahrC mRNA are highlighted in grey. The SD sequence of ahrC is boxed. Mutations in GGAs of SR1 and ahrC are indicated.
![Figure 1. Secondary structures of SR1 and ahrC483 mRNA.Secondary structures of SR1 (a) and ahrC mRNA (b) as determined before [Citation8] are shown. GGA motifs are highlighted in black and numbered. Complementary regions A to G in SR1 and A’ to G’ in ahrC mRNA are highlighted in grey. The SD sequence of ahrC is boxed. Mutations in GGAs of SR1 and ahrC are indicated.](/cms/asset/57edb3e6-1474-4b84-97c3-3477d51b7204/krnb_a_1605811_f0001_b.gif)
Figure 2. CsrA binds to SR1 and ahrC mRNA.
EMSA with purified internally α 32-P-[UTP] labelled RNA and increasing concentration of purified CsrA. 0.15 fmol of labelled wild-type or mutated SR1 or ahrC mRNA species of different size were incubated with CsrA at the indicated concentrations in a total volume of 10 µl (final RNA concentration 0.015 nM) for 10 min, followed by separation on 4% (ahrC RNA) or 8% (SR1) native PAA gels. The investigated mutations are indicated. Autoradiograms of the gels are shown. (a) EMSAs with wild-type and mutated SR1 species. (b) Competition EMSA with heterologous RNAIII (left) or unlabelled SR1 species (right). Above, the fold excess of the competitor RNA is indicated. (c) EMSAs with wild-type full-length ahrC483 mRNA containing 11 GGA* motifs (left) and shortened (nt 1–136) ahrC136 mRNA containing the three 5ʹ GGA*s (centre) as well as ahrC136 RNA mutated in the GGA*s (right) are shown. (d) EMSAs with ahrC483 mRNA mutated in addition to GGA1*-3* in one other GGA*.
![Figure 2. CsrA binds to SR1 and ahrC mRNA.EMSA with purified internally α 32-P-[UTP] labelled RNA and increasing concentration of purified CsrA. 0.15 fmol of labelled wild-type or mutated SR1 or ahrC mRNA species of different size were incubated with CsrA at the indicated concentrations in a total volume of 10 µl (final RNA concentration 0.015 nM) for 10 min, followed by separation on 4% (ahrC RNA) or 8% (SR1) native PAA gels. The investigated mutations are indicated. Autoradiograms of the gels are shown. (a) EMSAs with wild-type and mutated SR1 species. (b) Competition EMSA with heterologous RNAIII (left) or unlabelled SR1 species (right). Above, the fold excess of the competitor RNA is indicated. (c) EMSAs with wild-type full-length ahrC483 mRNA containing 11 GGA* motifs (left) and shortened (nt 1–136) ahrC136 mRNA containing the three 5ʹ GGA*s (centre) as well as ahrC136 RNA mutated in the GGA*s (right) are shown. (d) EMSAs with ahrC483 mRNA mutated in addition to GGA1*-3* in one other GGA*.](/cms/asset/f28646b2-a064-45b4-89f7-663874274eda/krnb_a_1605811_f0002_b.gif)
Figure 3. RNase footprinting of SR1 and ahrC136 mRNA at increasing concentrations of CsrA.
Secondary structure probing of 5ʹ labelled SR1 with RNases T1, T2 and A (a) and wild-type (b) and two SR1 mutants with RNases T1 (c) after binding of increasing concentrations of CsrA was performed as described in Materials and Methods. (d) Secondary structure probing of 5ʹ labelled ahrC136 mRNA with RNases T1, T2, A and nuclease S1 after binding of increasing amounts of CsrA. Red dots indicate enhanced protection, green dots better accessibility upon CsrA binding. Autoradiograms of the gels are shown. TL and T1L, T1 cleavage under denaturing conditions. OH, alkaline ladder. Bars indicate the positions of the GGA motifs. (e) Secondary structure of ahrC136 RNA as probed previously [Citation8]. The SD sequence is boxed; CsrA binding motifs are highlighted in black and region G’ for the initial interaction with SR1 in grey. Red and green residues indicate enhanced protection or accessibility, respectively, according to the autoradiogram shown in (d).
![Figure 3. RNase footprinting of SR1 and ahrC136 mRNA at increasing concentrations of CsrA.Secondary structure probing of 5ʹ labelled SR1 with RNases T1, T2 and A (a) and wild-type (b) and two SR1 mutants with RNases T1 (c) after binding of increasing concentrations of CsrA was performed as described in Materials and Methods. (d) Secondary structure probing of 5ʹ labelled ahrC136 mRNA with RNases T1, T2, A and nuclease S1 after binding of increasing amounts of CsrA. Red dots indicate enhanced protection, green dots better accessibility upon CsrA binding. Autoradiograms of the gels are shown. TL and T1L, T1 cleavage under denaturing conditions. OH, alkaline ladder. Bars indicate the positions of the GGA motifs. (e) Secondary structure of ahrC136 RNA as probed previously [Citation8]. The SD sequence is boxed; CsrA binding motifs are highlighted in black and region G’ for the initial interaction with SR1 in grey. Red and green residues indicate enhanced protection or accessibility, respectively, according to the autoradiogram shown in (d).](/cms/asset/b59669cf-d204-4df9-a189-d9f0c2816130/krnb_a_1605811_f0003_c.jpg)
Figure 4. Effects of CsrA on the stability of both SR1 and ahrC mRNA and on ahrC translation.
(a) The half-life of SR1 was determined in wild-type strain DB104 and in the isogenic ∆csrA strain after rifampicin addition and Northern blotting as described in Materials and Methods. (b) The half-life of ahrC mRNA was determined by qRT-PCR as described in Materials and Methods. In both cases, cultures were grown in complex TY medium to OD600 = 4.5. The average values obtained from three biological replicates with standard deviations are shown. (c) In vitro translation of ahrC in the presence and absence of CsrA and/or SR1. In vitro translation was performed as described in Materials and Methods. Used amounts of CsrA, SR1start to stop and ahrC RNA are indicated. Below, the amounts of synthesized protein relative to the reaction only containing the ahrC template are shown. (d) Translational ahrC-lacZ fusions under the constitutive promoter pI were integrated into the amyE locus of B. subtilis DB104, DB104 (∆csrA), DB104 (∆sr1) as well as DB104 (∆sr1 pWSR1) and DB104 (∆sr1 ∆csrA pWSR1). β-galactosidase activities were measured after growth in TY medium at OD600 = 4.5. In all cases, the indicated values are the results of three biological replicates. Error bars represent standard deviations. Control, vector pGAB1 with promoterless lacZ integrated into the amyE locus. Induction, sr1 transcription from pWSR1 was induced with 0.2 µg/ml anhydrotetracycline.
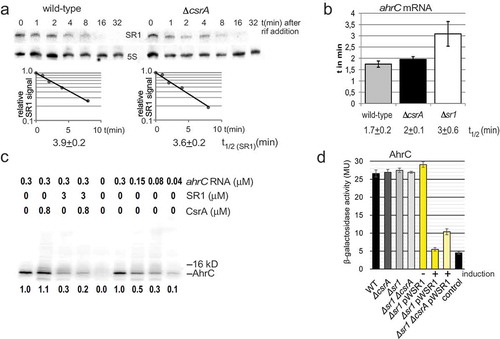
Figure 5. SR1/ahrC mRNA complex formation in the presence and absence of CsrA.
In both cases, 1 µM CsrA was employed if indicated and complex formation monitored in 6% native PAA gels as described in Materials and Methods. The labelled RNAs (0.15 fmol per reaction) were used in at least 100-fold lower equimolar amounts than the unlabelled RNAs. (a) Complex formation between internally α-32P-[UTP]-labelled SR1 and unlabelled full-length ahrC483 mRNA. Used ahrC mRNA concentrations are indicated. (b) Complex formation between internally α-32P-[UTP]-labelled full-length ahrC483 mRNA and unlabelled SR1. Used SR1 concentrations are indicated.
![Figure 5. SR1/ahrC mRNA complex formation in the presence and absence of CsrA.In both cases, 1 µM CsrA was employed if indicated and complex formation monitored in 6% native PAA gels as described in Materials and Methods. The labelled RNAs (0.15 fmol per reaction) were used in at least 100-fold lower equimolar amounts than the unlabelled RNAs. (a) Complex formation between internally α-32P-[UTP]-labelled SR1 and unlabelled full-length ahrC483 mRNA. Used ahrC mRNA concentrations are indicated. (b) Complex formation between internally α-32P-[UTP]-labelled full-length ahrC483 mRNA and unlabelled SR1. Used SR1 concentrations are indicated.](/cms/asset/69902a1a-8643-4d8b-8e0c-be2fb8fcc688/krnb_a_1605811_f0005_b.gif)
Figure 6. Effects of CsrA on the transcription from rocABC and rocDEF promoters.
Transcriptional procABC-lacZ and procDEF-lacZ fusions were integrated into the amyE locus of B. subtilis and β-galactosidase activities measured after growth in TY medium until stationary phase at OD600 = 4.5. The indicated values are the results of three biological replicates. Error bars represent standard deviations. (a) DB104 wild-type and the indicated isogenic knockout and overexpression strains were used. (b) Effects of mutations in SR1 GGA2 and ahrC GGA1* and GGA3*. The indicated strains were used. VC, vector pMG16 with promoterless lacZ integrated into the amyE locus.
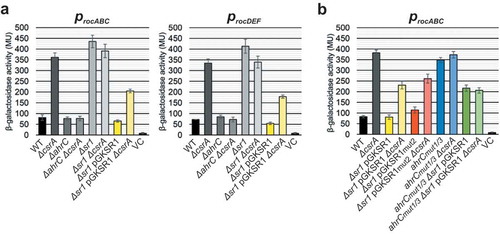
Figure 7. Effects of CsrA on the translation of rocA, rocD and ccpN.
(a) Schema of the pIII-rocA-lacZ fusion. Heterologous promoter pIII used to replace procABC is followed by the 5ʹ UTR of rocA (rocD, ccpN), the SD and the first 17 codons of the corresponding ORF fused in frame to the 2nd lacZ codon. (b) Translational rocA-lacZ, rocD-lacZ, and ccpN-lacZ fusions were integrated into the amyE locus of B. subtilis DB104 or DB104 (∆csrA) and β-galactosidase activities measured after growth in TY medium until OD600 = 4.5. In all cases, the indicated values are the results of three biological replicates. Error bars represent standard deviations.
Figure 8. Effects of CsrA and sr1 overexpression on the growth of B. subtilis in CSE minimal medium with different carbon sources.
(a) B. subtilis strain DB104 and its isogenic ∆sr1, ∆ahrC, ∆csrA mutants as well as ∆ahrC/∆csrA, ∆sr1(pGKSR1) and ∆sr1/∆csrA(pGKSR1) strains were inoculated at OD600 = 0.1 into CSE minimal medium or CSE supplemented with either glucose (CSEG) or arginine (CSEA) as additional carbon source and growth monitored over 8 h. (b) Investigation of the effects of mutated CsrA binding sites in SR1 (pGKSR1mut2) and ahrC mRNA (ahrCmut1/3) on growth in CSEA. The indicated strains were used. Growth curves in CSE and CSEG are identical and not shown. Data shown with standard deviations (error bars are very small) are the results of four biological replicates.
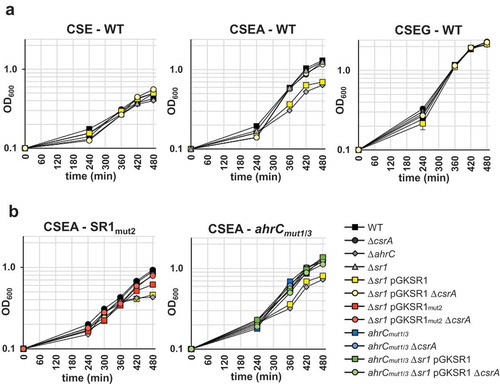
Figure 9. Complex formation between wild-type and mutant SR1 and ahrC mRNA species in the presence and absence of CsrA.
1 µM CsrA was employed if indicated and complex formation monitored as described in Materials and Methods. The internally α 32[P]-[UTP] labelled SR1 species (0.15 fmol per reaction) were used in at least 100-fold lower equimolar amounts compared to the unlabelled ahrC mRNA species. Used ahrC mRNA concentrations are indicated. (a) Complex formation between SR1WT and ahrCWT mRNA. (b) Complex formation between SR1mut2 and ahrCWT mRNA. (c) Complex formation between SR1WT and ahrCmut1 mRNA (d) Complex formation between SR1WT and ahrCmut2+3 mRNA. Autoradiograms of the gels are shown. Below the gels, the percentage of SR1/ahrC mRNA complexes calculated with the AIDA software (Raytest) is indicated.
![Figure 9. Complex formation between wild-type and mutant SR1 and ahrC mRNA species in the presence and absence of CsrA.1 µM CsrA was employed if indicated and complex formation monitored as described in Materials and Methods. The internally α 32[P]-[UTP] labelled SR1 species (0.15 fmol per reaction) were used in at least 100-fold lower equimolar amounts compared to the unlabelled ahrC mRNA species. Used ahrC mRNA concentrations are indicated. (a) Complex formation between SR1WT and ahrCWT mRNA. (b) Complex formation between SR1mut2 and ahrCWT mRNA. (c) Complex formation between SR1WT and ahrCmut1 mRNA (d) Complex formation between SR1WT and ahrCmut2+3 mRNA. Autoradiograms of the gels are shown. Below the gels, the percentage of SR1/ahrC mRNA complexes calculated with the AIDA software (Raytest) is indicated.](/cms/asset/87d30f48-8206-4cbb-beed-e7ef7f37f48e/krnb_a_1605811_f0009_b.gif)
Figure 10. Function of CsrA in the SR1/ahrC mRNA system.
(a) Working model on the mechanism of CsrA action. SR1 binds ahrC mRNA within 7 complementary regions (A-G). ahrC mRNA region G’ responsible for the initial contact is partially sequestered in a short stem loop structure. In the absence of CsrA breathing of the stem loop structure opens G’ and allows inefficient binding of SR1. The interaction with SR1 induces structural changes within ahrC mRNA which prevent translation initiation. The presence of CsrA increases the SR1 mediated repression of ahrC mRNA translation as it facilitates the SR1/ahrC mRNA interaction. Initial CsrA binding to GGA1* and 3* opens ahrC region G’ which allows a more efficient SR1 binding and, hence, a more efficient repression of ahrC translation. Binding of additional CsrA molecules to GGA2 and 3 in SR1 and other GGA*s in ahrC mRNA that could further promote complex formation or stabilize the SR1/ahrC mRNA complex is conceivable. Yellow boxes: GGA motifs (numbering according to ); orange box: initial SR1/ahrC interacting regions G and G’; grey boxes: additional SR1/ahrC interacting regions; green circle: CsrA. (b) Flow diagram representing the regulatory functions of CcpN, SR1, CsrA and AhrC. CcpN is a transcription factor that represses sr1 transcription under gluconeogenic conditions [Citation28–Citation30]. SR1 is a trans-encoded regulatory RNA that binds ahrC mRNA thus inhibiting translation [Citation7,Citation8]. AhrC is the transcriptional activator of the rocABC and rocDEF operons [Citation7,Citation27]. For its activity, it has to bind L-arginine [Citation27]. CsrA promotes the base-pairing interaction between SR1 and ahrC mRNA (see ).
![Figure 10. Function of CsrA in the SR1/ahrC mRNA system.(a) Working model on the mechanism of CsrA action. SR1 binds ahrC mRNA within 7 complementary regions (A-G). ahrC mRNA region G’ responsible for the initial contact is partially sequestered in a short stem loop structure. In the absence of CsrA breathing of the stem loop structure opens G’ and allows inefficient binding of SR1. The interaction with SR1 induces structural changes within ahrC mRNA which prevent translation initiation. The presence of CsrA increases the SR1 mediated repression of ahrC mRNA translation as it facilitates the SR1/ahrC mRNA interaction. Initial CsrA binding to GGA1* and 3* opens ahrC region G’ which allows a more efficient SR1 binding and, hence, a more efficient repression of ahrC translation. Binding of additional CsrA molecules to GGA2 and 3 in SR1 and other GGA*s in ahrC mRNA that could further promote complex formation or stabilize the SR1/ahrC mRNA complex is conceivable. Yellow boxes: GGA motifs (numbering according to Figure 1); orange box: initial SR1/ahrC interacting regions G and G’; grey boxes: additional SR1/ahrC interacting regions; green circle: CsrA. (b) Flow diagram representing the regulatory functions of CcpN, SR1, CsrA and AhrC. CcpN is a transcription factor that represses sr1 transcription under gluconeogenic conditions [Citation28–Citation30]. SR1 is a trans-encoded regulatory RNA that binds ahrC mRNA thus inhibiting translation [Citation7,Citation8]. AhrC is the transcriptional activator of the rocABC and rocDEF operons [Citation7,Citation27]. For its activity, it has to bind L-arginine [Citation27]. CsrA promotes the base-pairing interaction between SR1 and ahrC mRNA (see Fig. 10A).](/cms/asset/5634db70-9a91-4781-9ec2-b59acb5967bf/krnb_a_1605811_f0010_c.jpg)