Figures & data
Figure 1. NET-prism as a tool to interrogate active RNA Pol II – interaction with associated proteins. (a) Schematic representation of the approach. For detailed experimental conditions, please refer to the Supplementary Information (‘NET-prism protocol’). Upon extraction of nascent RNA, libraries are made using the human NET-seq protocol [Citation9]. (b) Volcano plot of Pol II IP vs Mock (IgG) IP depicting a whole RNA Pol II – protein interactome as assessed by Mass spectrometry. Significant values (FDR < 0.05) are coloured in black. (c) Independent confirmation of identified RNA Pol II interactors using IP conditions as used in NET-prism followed by western blotting.
![Figure 1. NET-prism as a tool to interrogate active RNA Pol II – interaction with associated proteins. (a) Schematic representation of the approach. For detailed experimental conditions, please refer to the Supplementary Information (‘NET-prism protocol’). Upon extraction of nascent RNA, libraries are made using the human NET-seq protocol [Citation9]. (b) Volcano plot of Pol II IP vs Mock (IgG) IP depicting a whole RNA Pol II – protein interactome as assessed by Mass spectrometry. Significant values (FDR < 0.05) are coloured in black. (c) Independent confirmation of identified RNA Pol II interactors using IP conditions as used in NET-prism followed by western blotting.](/cms/asset/0cb5d60e-f729-4745-bab1-70f82ab9e814/krnb_a_1621625_f0001_oc.jpg)
Figure 2. NET-prism application on polymerase-bound transcription factors. (a) Metaplot profiles and heatmaps over protein-coding genes (n = 4,314) for polymerase associated elongation (Spt6, Ssrp1) and initiation (TFIID, Med14) factors. A 10-bp smoothing window has been applied. Blue = Sense transcription, Red = Anti-sense transcription. (b) RNA Pol II interrogation of all NET-seq/prism libraries over a single gene (Srsf6). (c) Cumulative distribution of Pol II travelling ratio as assessed by NET-prism.
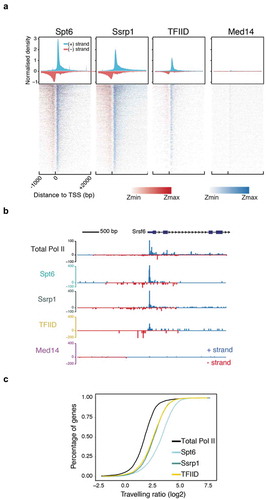
Figure 3. Sequential NET-prism. (a) Schematic illustration of the experiment. Peptide elution was performed using the same CTD peptide used for antibody production and was used in excess. (b) Metaplot profile comparing single and sequential IP. (c) Single gene snapshot comparing single and sequential IP.
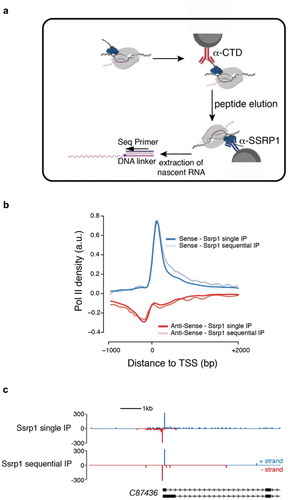
Figure 4. Association of different proteins with transcriptional splicing as assessed by NET-prism. (a) Heatmaps and metaplots assessing polymerase pausing for total Pol II and Splicing factor 1 (Sf1) over exon boundaries (n = 5,550). Solid lines indicate the mean values, whereas the shading represents the 95% confidence interval. (b) Boxplots measuring Pol II coverage over exons (n = 41,356) and introns (n = 199,172) for each NET-seq/prism library. First and last exons are removed from the analysis. (c) RNA Pol II interrogation of all NET-seq/prism libraries over a single gene (Actb). Exons are highlighted in purple.
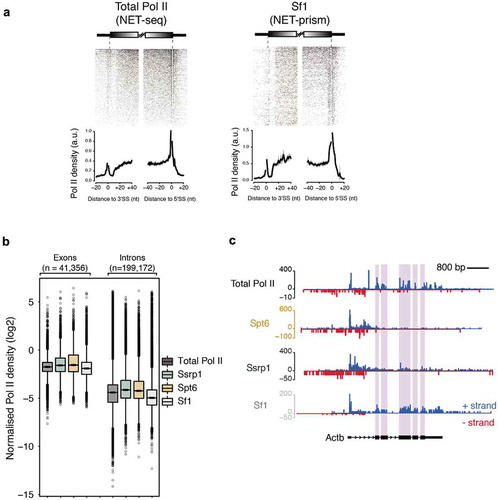
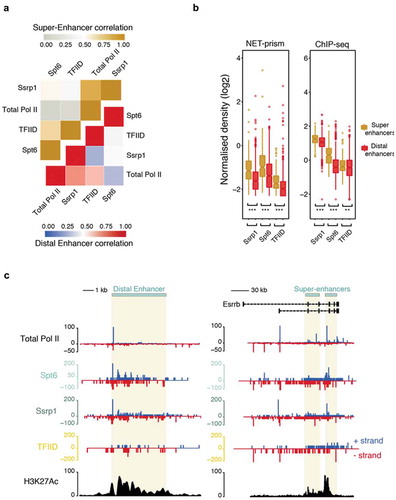
Figure 5. Distinctive patterns of transcriptional regulation over enhancers and super-enhancers. (a) Pearson’s correlation heatmap among NET-seq/prism libraries over distal enhancers (blue – red) and super-enhancers (grey – gold). (b) Boxplots measuring either transcription factor (ChIP-seq) or Pol II (NET-prism) density over distal enhancers (red) and super-enhancers (gold). Significance was tested via the Wilcoxon rank test (** p < 1.0e−10, *** p < 2.2e−16). (c) Pol II distribution over a distal (chr1: 86,484,171–86,495,700) or super-enhancer as assessed by NET-seq/prism. H3K27Ac density is depicted in black colour. Blue and red depict RNA Pol II pausing in the positive and negative strand, respectively.