Figures & data
Table 1. Linear transcripts and HS circRNAs retrieved from circBase. Linear transcript, circRNA circBase ID, circRNA genomic position, circRNA genomic length and circRNA spliced length are reported in columns in the table.
Table 2. Linear transcripts and MM circRNAs retrieved from circBase. Linear transcript, circRNA circBase ID, circRNA genomic position, circRNA genomic length and circRNA spliced length are reported in columns in the table.
Figure 1. Expression of candidate circRNAs (a), circNAPEPLD and linear NAPEPLD in HS (b) and MM (c) SPZ and tissues. (a) Heat Map showing the expression of the six candidate circRNAs. Data are shown as 40 – Ct. (b and c) Bar chart showing the expression values relating to NAPEPLD circular and linear isoforms in Homo sapiens and Mus musculus samples, respectively. RNA from testis was used as calibrator. Expression is shown as Log2 of RQ compared to testis.
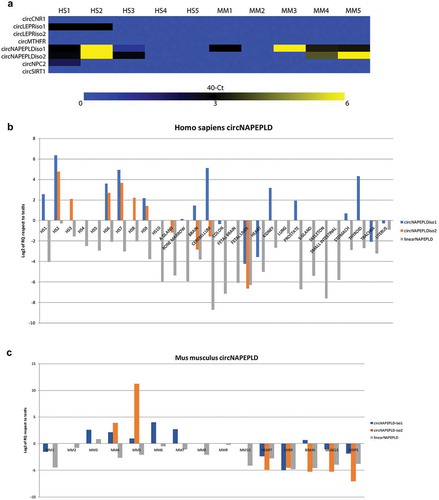
Table 3. miRNAs interacting with circNAPEPLDiso1 as revealed by TLDA analysis. MiRNAs are ordered following decreasing LOG fold-change (FC) values (N/A = not annotated).
Figure 2. circNAPEPLDiso1 miR-CATCH. (a) Fold enrichment (FC) of circNAPEPLDiso1, linear NAPEPLD and U6 are shown as IPed samples/input. U6 FC was set to one and FC of circNAPEPLDiso1 and linear NAPEPLD mRNA were calculated accordingly (*** p-value, < 0.0001; N = 3, Student’s t-test). (b) Heat Map showing the expression of miRNAs enriched in circNAPEPLDiso1-miR-CATCHed samples as compared to negative control (Scramble-miR-CATCHED). Data are reported as −1*DCt and U6 was used as endogenous control. MiRNAs with FC ≥2.5 (TLDA data) and predicted to have at least one binding site within the circNAPEPLDiso1 sequence are shown in bold. (c) Fold enrichment (FC) of miR-203a-3p, miR-146a-5p and U6 are shown as IPed samples/input. U6 FC was set to one, and FC of miR-203a-3p and miR-146a-5p were calculated accordingly (**p-value, < 0.01; *p-value, < 0.05; N = 3, Student’s t-test).
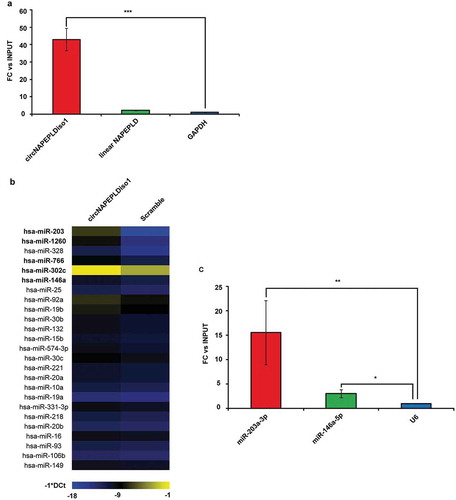
Table 4. Top 10 pathways enriched within miRNA targets interaction network.
Table 5. Top 10 pathways enriched within miRNA targets interaction network filtered for betweenness centrality (cut-off = 5).
Figure 3. Expression analysis of circNAPEPLDiso1 (a) and circNAPEPLDiso2 (b) in murine-unfertilized oocytes (NF) and in one-cell zygotes (F) by qRT-PCR. N = 5 pools each containing 10 NF and N = 5 pools each containing 10 F were used for the expression analysis. Data are expressed as normalized fold expression (nfe) using Actb as endogenous control (**p-value, < 0.01 Student’s t-test).
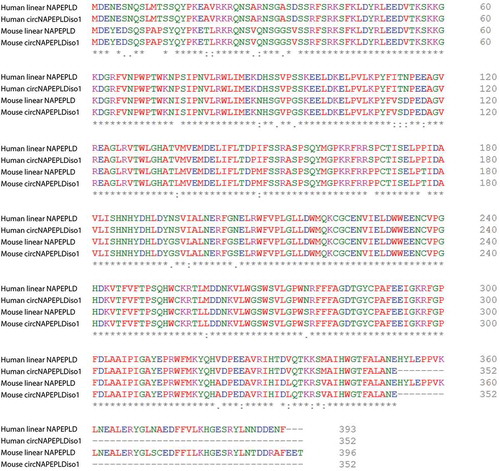
Figure 4. Multiple alignment among proteins from HS and MM linear and circular NAPEPLDiso1.