Figures & data
Figure 1. ASPACT is highly expressed during viral infection. a Gene structure and orientation of ASPACT and PACT genes. The ASPACT gene encodes three splice variants: V1, V2, and V3 (identified exons shown as black rectangles). The arrows were represented as the orientation of transcription for ASPACT and PACT. b–e Expression levels of ASPACT and PACT were profiled on the basis of various microarray datasets archived in the GEO. Alterations in the indicated biological contexts are shown by box plots: b, d blood samples from patients with acute DENV infection (n = 18), during convalescence (n = 19), and healthy controls (n = 9); c, e well-differentiated primary lung bronchial epithelial cells 36 h after infection with seasonal H1N1 BN/59, pandemic H1N1 KY/136 and KY/180 (n = 3). In all panels, data represent the mean and SEM (error bars). Significant differences were verified by Student’s t test (ns: P > 0.05, *: P < 0.05, **: P < 0.01, ***: P < 0.001).
Figure 2. Structure and expression of the ASPACT transcript unit. a Expression of the ASPACT RNA transcript (1.4 kbp) was detected by Northern blot assay using total RNA isolated from nuclei and cytoplasm compartments of HeLa cells. The loading control is shown in the lower panel; 28S: 4.8 kbp, 18S: 1.9 kbp. mRNA sizes are indicated in kbp. b Interferon inducibility of ASPACT RNA expression was detected by Northern blot assay using IFN-treated HeLa cells. The loading control is shown in the lower panel: 28S: 4.8 kbp, 18S: 1.9 kbp. c After IFN-β treatment for 6 h, total RNA was extracted from HeLa cells for RT-qPCR analysis of ASPACT and PACT expression. Expression levels were normalized to an internal control, EF1A, and are presented relative to the mock sample. d Changes in subcellular distribution of ASPACT and PACT transcripts. After IFN-β treatment for 6 h, HeLa cells were subjected to subcellular fractionation, and the expression of transcripts in each fraction was evaluated by qPCR. e Nuclear run-on assay was performed to measure levels of newly synthesized PACT and ASPACT RNAs in IFN-treated HeLa cells, followed by qPCR analysis. Prior to fold-change calculations, target gene expression levels were normalized to that of EF1A. The mock treatment is represented as the reference. f ChIP assay was utilized to demonstrate pSTAT1 occupancy of ASPACT chromatin in IFN-treated HeLa cells. Precipitated DNA fragments were analysed by qPCR using primers corresponding to different regions of ASPACT chromatin, and normalized to the value of IgG. A schematic of the qPCR amplicon in the pSTAT1 binding region is depicted in the upper panel. In all panels, data represent the mean and SEM (error bars) from four independent experiments. Significant differences were verified by Student’s t test (ns: P > 0.05, *: P < 0.05, **: P < 0.01, ***: P < 0.001).

Figure 3. Regulatory role of ASPACT in PACT expression. a Expression of ASPACT was abolished by oligodeoxynucleotide-based knockdown in HeLa cells. Cells were then treated with IFN-β for 6 h to mimic viral infection, and subjected to gene expression analysis. The RNA abundance of PACT was analysed by qPCR and normalized to EF1A level. b Protein levels of PACT in ASPACT knockdown and IFN-treated HeLa cells were measured by Western blot assay using ACTIN as an internal control. c, d ASPACT expression and control vectors were transfected into HeLa cells, and subsequently collected for RNA (c) and protein (d) expression analysis. PACT RNA abundance was analysed by qPCR and normalized to EF1A levels. PACT protein expression was measured by Western blot assay, using ACTIN as the internal control. In all panels, data represent the means and SEM (error bars) from four independent experiments. Significant differences were verified by Student’s t test (ns: P > 0.05, *: P < 0.05, **: P < 0.01, ***: P < 0.001).
Figure 4. ASPACT negatively regulates PACT expression at the transcriptional level. a, b Nuclear run-on assay was performed to measure levels of nascent PACT RNA in ASPACT knockdown and IFN-treated (a) or ASPACT overexpressing (b) HeLa cells, followed by qPCR analysis. Prior to fold-change calculations, target gene expression levels were normalized to that of EF1A. The mock treatment represents as the reference. c ChIP assay was performed to demonstrate RNA Pol II occupancy of the PACT promoter chromatin. Precipitated DNA fragments were analysed by qPCR and normalized to the value of IgG. The extent of occupancy was compared between control and ASPACT-overexpressing HeLa cells. d Predicted complementary region (CR) in the PACT gene locus with potential correspondence to the ASPACT sequence. Three distinct CRs were uncovered based on high sequence alignment scores, and are represented as rectangles in relation to the CpG island and the gene body of PACT. e ChIRP analysis of ASPACT binding to the PACT chromatin. Retrieval of PACT chromatin DNA was validated by qPCR analysis of the indicated regions (using EF1A as the control). Results are expressed as retrieval rate of chromatin DNA relative to the input. For the bar graphs shown in this figure, data represent the means and SEM (error bars) from four independent experiments. Significant differences were verified by Student’s t test (ns: P > 0.05, *: P < 0.05, **: P < 0.01, ***: P < 0.001).
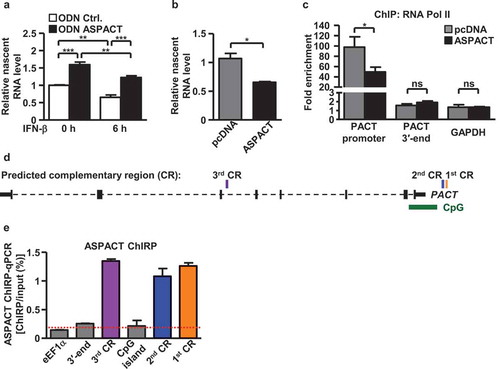
Figure 5. ASPACT associates with HDAC1 and mediates its promoter recruitment. a, b The protein–RNA interaction of HDAC1 (a) and EZH2 (b) with ASPACT was demonstrated by RNA-IP assay. HeLa cell lysates were collected and subsequently immunoprecipitated with specific antibodies, and the precipitated RNA was quantified by qPCR and normalized to the value of IgG. GAPDH served as negative control. c, d Extent of HDAC1 (c) and EZH2 (d) association with the PACT chromatin locus in ASPACT overexpressing cells was examined by ChIP assay. The precipitated DNA fragments corresponding to the promoter and 3′-end regions were analysed by qPCR and normalized to the value of IgG. GAPDH served as a negative control. In all panels, data represent the means and SEM (error bars) from four independent experiments. Significant differences were verified by Student’s t test (ns: P > 0.05, *: P < 0.05, **: P < 0.01, ***: P < 0.001).
Figure 6. ASPACT mediates nuclear retention of PACT mRNA via direct RNA–RNA interaction. a–c ASPACT knockdown HeLa cells were treated with IFN-β for 6 h then subjected to subcellular fractionation. The abundance of PACT transcript in each fraction was assessed by qPCR, and normalized to U48 and 7SL, individually (a). Western blot analysis was also performed to profile the expression of PACT protein (Lamin A/C and GAPDH serving as nuclear and cytosolic markers, respectively) (b). C, D Expression alterations of PACT RNA (c) and protein (d) in response to ectopic overexpression of ASPACT. Transfected HeLa cells were fractionated into nuclear and cytosol compartments and assessed for RNA and protein expression levels via qPCR and immunoblotting, respectively. E RT-qPCR was used to measure the percentage of the total cellular ASPACT, PACT, or negative control EF1A recovered after RAP-RNA of ASPACT from HeLa cells (see Methods section). Values correspond to the amount of RNA in the elution divided by that in the input lysate. In all panels, data represent the means and SEM (error bars) from four independent experiments. Significant differences were verified by Student’s t test (ns: P > 0.05, *: P < 0.05, **: P < 0.01, ***: P < 0.001).
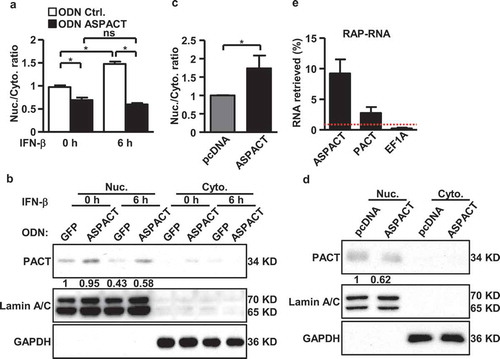
Figure 7. Functional link of ASPACT to the innate immunity. a–e ASPACT knockdown HeLa cells were treated with or without IFN-β for 6 h and subsequently harvested for RT-qPCR (a–d) or Western blot (e) analyses of the indicated ISGs. mRNA expression was normalized to the level of EF1A, while ACTIN and GAPDH were used as the loading control in immunoblotting. F HeLa cells were transfected with ASPACT expression and control vectors and subsequently collected for RIG-I, PKR, and ISG15 and expression analysis via Western blot assay (using GAPDH as the internal control). For the bar graphs shown in this figure, data represent the means and SEM (error bars) from four independent experiments. Significant differences were verified by Student’s t test (ns: P > 0.05, *: P < 0.05, **: P < 0.01, ***: P < 0.001).