
Figures & data
Figure 1. Mapping and folding structure of Listeria monocytogenes Rli47. (a) Mapping rli47 on the genome of Listeria monocytogenes EGD-e. A σB-dependent promoter (PB) is represented, and the lollipop structure denotes a hypothetical transcription terminator structure shared by rli47 and lmo2142. (b) Folding structure was predicted in silico by mfold. The six stem-loop structures were labelled from A to F. (c) Secondary structure of Rli47 small RNA modelled using in vivo DMS-MapSeq structure probing. ‘DMS values’ represent DMS mediated methylation of adenine (a) and cytosine (c) nucleotides, respectively. A DMS value lower than one indicates a base-paired A or C whereas a DMS value higher than one indicates an unpaired A or C. The obtained DMS values were used as guides for the modelling of the Rli47 secondary structure. The six stem-loop structures were labelled based on their position relatively to the in silico structure, as derivative structures were named A’ and E’
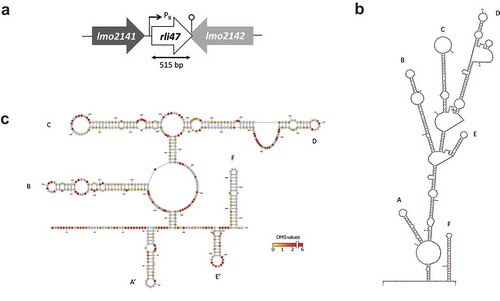
Figure 2. Northern blot analysis of Rli47 expression on a σB-dependent manner. Samples were taken from L. monocytogenes EGD-e wild-type (WT), ΔsigB and Δrli47 cultures at exponential and stationary phases in DM + 0.4% Glucose at 37°C. Northern blot was probed for Rli47 and 16S rRNA as a loading control. Relative levels of Rli47 transcripts were normalized to 16S and are shown below each lane. Vertical lines between bands represent a non-sequential loading of the samples of interest. Representative of two independent technical replicates of two biological samples per condition
Table 1. Interactions between target mRNAs and Rli47 predicted in silico. Predictions were obtained by the IntaRNA software [Citation32–Citation34]. Top four hypothetical targets which binding prediction fulfilled the selection criteria: (i) Energy > −16 KJ mol−1; (ii) Single-strand region on Rli47; (iii) Overlap the Shine-Dalgarno region on the target mRNA. No σB promoter was found in silico in any of the target genes [Citation25]. TSS – transcription start site
Figure 3. Rli47 and hypothetical target mRNAs base-pairing by Electrophoretic Mobility Shift Assay. Labelled Rli47 full-size transcripts were incubated with increasing concentrations of unlabeled ilvA, addB, ribCF or copB mRNA. The fraction of unbound Rli47 is shown below each lane
Figure 4. Mutational Analysis of truncated Rli47 and ilvA mRNA base pairing by Electrophoretic Mobility Shift Assay. (a) Predicted basepairing between the SD region of ilvA mRNA and Rli47. The mutated nucleotides are shown in red and the sequences of the minimal mutant variants ilvA-SDCACC and sRli47GGUG are indicated. (b) Electrophoretic mobility shift assays (EMSAs) of the interaction between ilvA mRNA and Rli47 truncated transcripts (sRli47). Truncated (sRli47) transcripts of Rli47 were incubated with increasing concentrations of unlabeled ilvA mRNA. (c) Secondary structure denaturation step was performed previous to binding incubation of labelled sRli47 and sRli47GGUG with increasing concentrations of unlabeled ilvA RNA or the mutant ilvA-SDCACC. Similar results were shown even without the denaturation of the secondary structures (Fig. S5). The fraction of unbound Rli47 is shown below each lane. AUG denotes the start codon of ilvA.
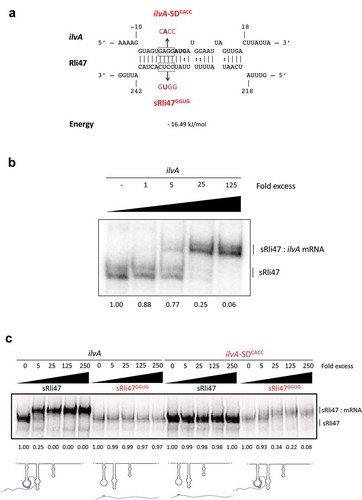
Figure 5. Impact of sigB or rli47 deletion on ilvA expression in exponential growth phase cells in DM. Quantification of rli47 and ilvA in the ∆rli47 or ∆sigB relative to the wild-type was assessed by RT-qPCR and normalized to 16S RNA. Logarithmic fold change values on the mutant strains are relative to the wild-type. The data represent three biological replicates with three technical independent repetitions. Error bars indicate standard deviation. Asterisks represent p-values (* = p-value <0.05, ** = p-value <0.001, *** = p-value <0.0001) calculated using a Two-way ANOVA with Sidak’s multiple comparisons test. Ns: not significant
Figure 6. Assessing the effect of Rli47 on the Branched-chain amino acids isoleucine pathway under isoleucine depletion. (a) Growth of L. monocytogenes EGD-e wild-type (WT), ΔsigB, Δrli47 and rli47-complement in chemically defined medium (DM) with and without L-isoleucine. Bacterial growth at 37°C was monitored until all cultures reached stationary phase. The average of three biological replicates is shown, and error bars represent standard deviation. Doubling and lag times are represented in Table S3. (b) Threonine deaminase activity in WT, ΔsigB and Δrli47 cells grown in DM and L-isoleucine depleted medium (DM-ile). Representation of average and standard deviation of two technical replicates of three biological samples per condition. Error bars indicate standard deviation. Asterisks represent p-values (* = p-value <0.05, ** = p-value <0.001, *** = p-value <0.0001) calculated using a Student’s t-test, unpaired with Welch’s correction. (c) Representation of the branched-chain amino acid pathway of isoleucine biosynthesis from L-threonine in L. monocytogenes. Adapted from MetaCyc (22)
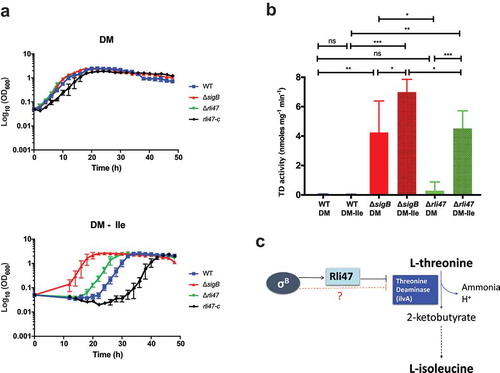
Figure 7. Expression analysis of genes differentially transcribed by L. monocytogenes rli47 deletion mutant grown to exponential phase in defined media, summarizing RNA sequencing results. (a) Volcano plots displaying differentially expressed genes in exponential phase DM. The top 20 most upregulated and downregulated significantly expressed genes are labelled. The negative log10 of p-value is plotted on the Y-axis, and the log2FC is plotted on the X-axis. The red points on this graph represent sRNAs and mRNAs that are significantly differently expressed in the rli47 deletion mutant (p-value <0.05), the blue points represent sRNAs and mRNAs with p-value >0.05. The horizontal line represents the p-value >0.05 cutoff. The horizontal lines represent a − 0.58> log2FC > 0.58 cutoffs. (b) Relative abundance of categories of genes differentially expressed by L. monocytogenes rli47 deletion mutant comparatively to the wild-type EGD-e. Left pie chart, percentage of genes belonging to each COGs in the whole genome of L. monocytogenes EGD-e (NC_003210.1). Right upper pie chart, genes upregulated compared with wild-type; right down pie chart, genes downregulated compared with wild-type. Colours correspond to categories in the COGs database
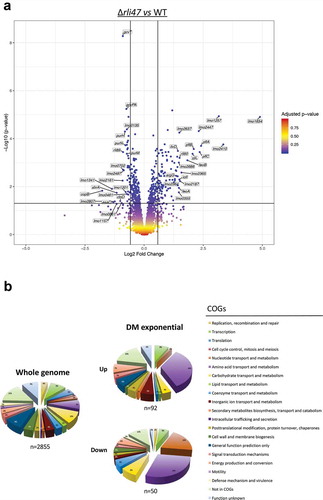
Figure 8. Proposed model of the regulatory effect of Rli47 on isoleucine biosynthesis in L. monocytogenes. Transcription of rli47 is under σB control and when it is expressed it interacts directly with mRNA from the ilv-leu operon at the predicted Shine-Dalgarno sequence upstream from the ilvA start codon. The Rli47-ilv interaction blocks the first step of isoleucine biosynthesis by preventing the translation of ilvA to produce threonine deaminase (TD), and also by affecting the stability of the ilv-leu transcript. σB negatively influences the activity of TD through an Rli47-independent route which remains to be identified. CodY represses transcription of the ilv-leu operon in a manner that depends on the availability of isoleucine (ile) through an interaction with two binding sites, shown in green [Citation10,Citation12]. When σB is active Rli47 influences the CodY regulon through an effect on the cytoplasmic pool of isoleucine
![Figure 8. Proposed model of the regulatory effect of Rli47 on isoleucine biosynthesis in L. monocytogenes. Transcription of rli47 is under σB control and when it is expressed it interacts directly with mRNA from the ilv-leu operon at the predicted Shine-Dalgarno sequence upstream from the ilvA start codon. The Rli47-ilv interaction blocks the first step of isoleucine biosynthesis by preventing the translation of ilvA to produce threonine deaminase (TD), and also by affecting the stability of the ilv-leu transcript. σB negatively influences the activity of TD through an Rli47-independent route which remains to be identified. CodY represses transcription of the ilv-leu operon in a manner that depends on the availability of isoleucine (ile) through an interaction with two binding sites, shown in green [Citation10,Citation12]. When σB is active Rli47 influences the CodY regulon through an effect on the cytoplasmic pool of isoleucine](/cms/asset/3ef78c45-4797-4a58-8cdf-0e65db05e1a3/krnb_a_1632776_f0008_oc.jpg)