Figures & data
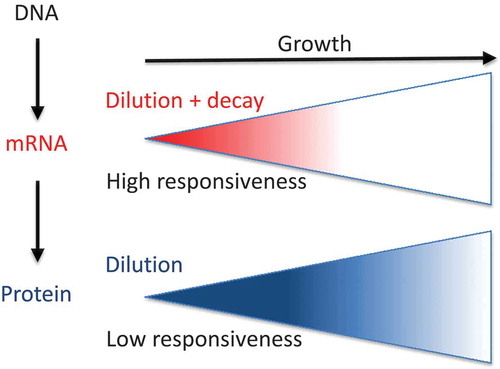
Table 1. Abundances of molecules and synthesis machineries.
Table 2. Generation time (GT) correlations with ribosome and mRNA concentration and mRNA and protein stabilities.
Figure 1. Quantitation of the Central Dogma in eukaryotes.
Using data from published references (see M&M for a detailed description), we herein represent the amounts of the molecules involved in the flux of information from DNA (genome) to protein in S. cerevisiae as an example of eukaryotic cells. It should be similar, in relative proportions, for other eukaryotes. For a haploid budding yeast, the number of RNAs falls within the range of 10−4–10−6, including mRNAs, tRNAs and rRNAs. Other RNAs come in much smaller amounts and are not considered herein. The relative proportions of RNA types and transcription costs are shown (see M&M for details). The percentage of RNA pol II transcription devoted to ribosome-related proteins (10%) and the other proteins (from ref. Citation15) and that of RNA pol III devoted to tRNAs and 5S rRNA (see M&M) are shown. Note that as the total number of protein molecules and their total translation rates are higher than their mRNA counterparts, the translation cost is much higher. The * indicates that we here take the number of ribosomes as number or molecules of rRNA, but it should be considered that each ribosome has 4 independent rRNA molecules, three transcribed by RNA pol I as a single nascent transcript: 5.8S, 18S and 25S; and another transcribed by RNA pol III: 5 S.
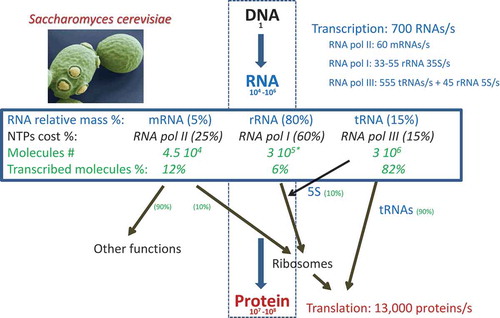
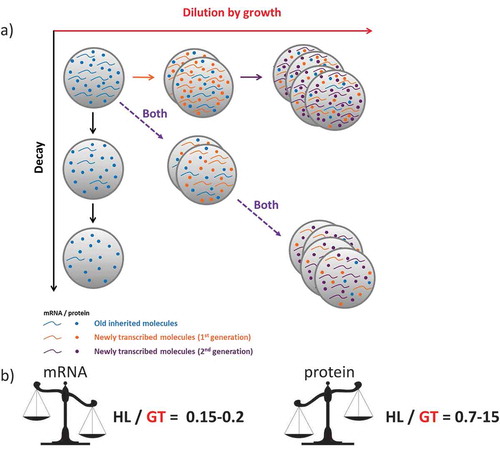
Figure 2. A comparison of the relative contributions of the decay and dilution rates for mRNAs and proteins.
(a) In actively dividing cells, the synthesis rates for any molecule should compensate both the degradation (decay, in y axes) and dilution caused by an increase in cell mass/volume (growth, x axes) if a homeostatic concentration is to be maintained (both processes, diagonal). Note that horizontal and vertical represent the hypothetical situations with only one process occurring. (b) For mRNAs, which are relatively short-lived molecules, the proportion of transcription devoted to compensate the degraded molecules and dilution, expressed herein as the ratio between half-lives (HLs) and generation times (GTs), is approximately constant for all the studied organisms: about 15–20%. We interpret this as a trade-off between response capacity and synthesis costs. On the contrary, for those proteins that are very stable and more abundant than mRNAs, synthesis is devoted mostly to compensate dilution with a HL/GT ratio that is very high and variable. Thus for proteins, a trade-off between response capacity and synthesis costs does not seem to be an evolutionary constraint (see the main text for details).