Figures & data
Table 1. Read counts (in Million) and mapping statistics, obtained from all samples of the respective tissue.
Figure 1. Circular representation of the sus scrofa genome and sncRNA annotation obtained from our data set. (a) According to the legend on the right-hand side, the outer ring depicts the chromosome and genomic position (in 2Mb intervals). Stacked and coloured tiles correspond to annotated loci on the sus scrofa genome (referred to as sncRNA genes). Tiles are stacked and sorted according to mean transcript abundance; its colour and transparency encode for the sncRNA class (miRNA – blue, snoRNA – green, rRNA – yellow, tRNA – red) and the mean transcript abundance of the respective sncRNA gene. The (black-and-white) heatmap depicts the general transcript abundance (from high (black) to no activity (white)) for each locus and tissue with the following order (from outside to the inside of the circle): Amygdala, Hippocampus, Hypothalamus, Adrenal gland. The undirected links in the centre of the image indicate tRNA gene copies. See legend in (b) or text for more details.
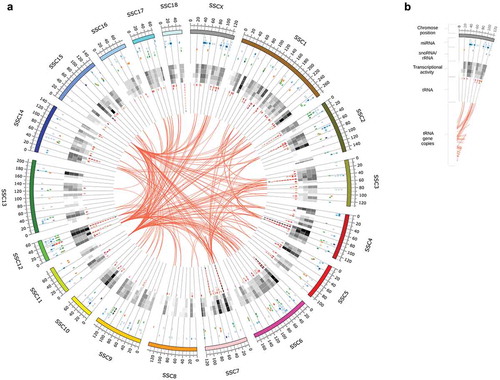
Figure 2. (a) Average sncRNA composition for each tissue, based on a sample-wise aggregation of all normalized read counts of transcripts that belong to the same sncRNA type. (b) Tissue-specific distribution of sample-wise aggregated (normalized) read counts of major sncRNA types. (c) Two-dimensional biplot of the first two principal components of the normalized transcript count matrix for each tissue and the top 15 variables (transcripts) with the highest variable loading. (d) Heatmap of top 50 sncRNA transcripts with the highest mean of normalized counts.
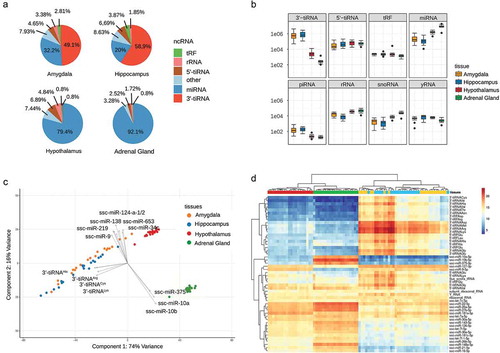
Table 2. Top 15 over-expressed sncRNA (based on normalized base means) for each tissue. Transcripts are considered over-expressed in a certain tissues, if their expression is significantly higher in the respective tissue compared to all other tissues, i.e. transcripts that are differentially expressed (FDR < 0.05) in all pairwise tests performed for the respective tissue. Tables of all DETs obtained from pairwise comparisons between all tissues including FDR values can be found in the supplementary material (Supplementary Table 2).
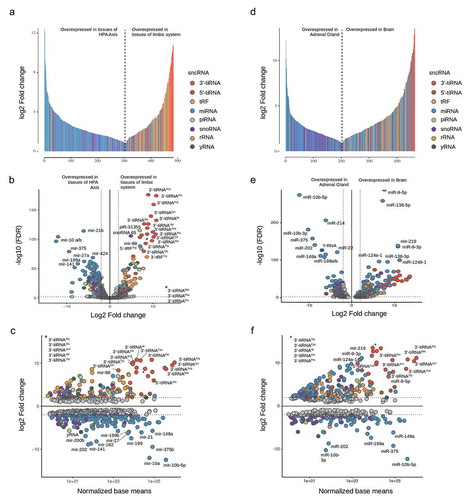
Figure 3. Differentially expressed transcripts between tissue samples coloured according to sncRNA type (a–c) Limbic system (Amygdala and Hippocampus) vs. HPA Axis (Hypothalamus and Adrenal gland); (d–f) Brain (Amygdala, Hippocampus and Hypothalamus) vs Adrenal gland.