
Figures & data
Figure 1. Structure drawings in the (a) ‘radial’, (b) ‘flat base’, and (c) ‘rigid’ layouts.
Figure 2. A screenshot of the graphical user interface. Positions 3,924 to 3,930 are currently selected and highlighted in green. Highlighted in pink are two complementary subsequences whose pairings could be incorporated into the secondary structure, and highlighted in blue are two complementary subsequences whose pairings would be tertiary. At the bottom is the information bar, which displays helpful information such as (from left to right) what clicking the mouse will currently do, the currently selected subsequence and its positional range, the numbers of complementary subsequences, and the positional range of the entire sequence.
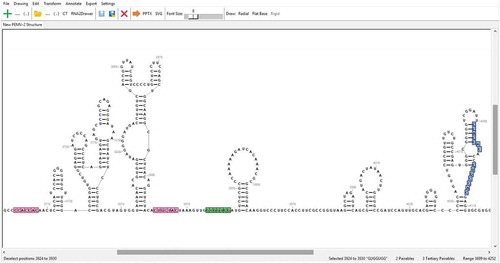
Figure 3. Example of a highly customized drawing. All manipulations were accomplished within the RNA2Drawer program. The font of bases and numbering is Times New Roman in bold. The width and length of the area occupied by a base are 1.6 and 1.6 units, respectively. The sequence numbering offset is 4,039, the numbering interval is 15, and numbering starts at position 4,050. Bases are coloured by structure probing data, and the colour of numbering is black. Circles with varying outline and fill colours/transparencies are drawn behind select subsequences. The thickness of base pair bonds is 1.5 units, and the padding between base pair bonds and participating bases is 1 unit. GC and AU bonds are coloured black, while GU and noncanonical bonds are coloured grey. The noncanonical bond between positions 4,180 and 4,201 is incorporated into the secondary structure, while the noncanonical bond between positions 4,153 and 4,162 is represented as a tertiary interaction with the capping lines omitted. The pseudoknot between positions 4,185 to 4,188 and 4,249 to 4,252 is also represented by a tertiary interaction.
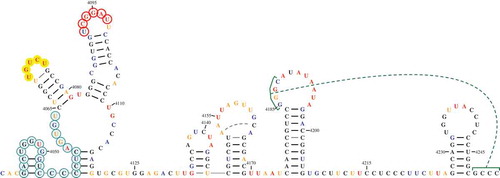
Table 1. Comparison of RNA2Drawer with other nucleic acid structure drawing programs.