Figures & data
Figure 1. CP affects cell proliferation and p27 mRNA stability in HEK293 but not in MCF7 cells. (a) Proliferation assay of cells treated (+CP; 20 µM) or not treated (-CP) with CP for the indicated time periods. (b) Trypan blue cell viability assay. Cells were counted (n = 3) and the result reported as a percentage of dead versus live cells in a bar plot. (c) Relative changes of p27 and p53 mRNAs in CP-treated (20 µM of CP for 15 h) compared to untreated (-CP) HEK293 and MCF7 cells as measured by RT-qPCR normalized to β-actin mRNA. Error bars represent the standard error of the mean (SEM), n = 3. *P < 0.05. (d) Immunoblot analysis with antibodies against the specified proteins. (e) HEK293 cells were treated with 20 µM CP for 15 h prior to the addition of 2 µg/ml of ActD for 30, 60, 90, 120, and 240 min. The half-life of p27 and c-myc mRNAs relative to β-actin was determined by RT-qPCR considering ‘one phase decay equation’ implemented in GraphPad Prism. Error bars represent SEM, n = 3.
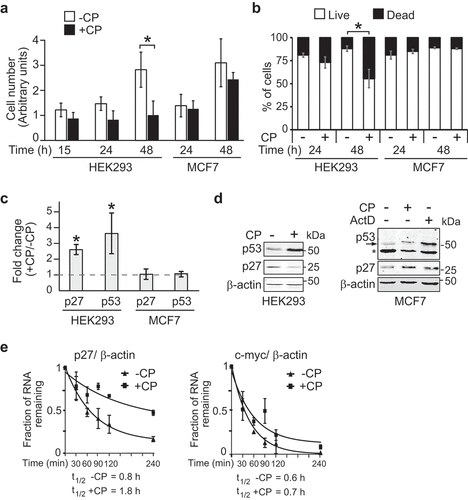
Figure 2. P27(3ʹUTR) reporter mRNA recapitulates post-transcriptional regulation in CP-treated cells. (a) Schematic representation of GFP-T and GFP-T-p27(3ʹUTR) reporter constructs. GFP-T cells lack exogenous p27 3ʹUTR sequences. (b) Changes in GFP and endogenous p27 mRNAs in CP-treated (+CP) compared to untreated (-CP) GFP-T and GFP-T-p27(3ʹUTR) inducible cell lines. Transcript levels were quantified with RT-qPCR and normalized to β-actin mRNA. Error bars represent SEM, n = 3. *P < 0.05, **P < 0.01. (c) mRNA decay of GFP-T-p27(3ʹUTR) in untreated (-CP) and CP-treated (20 µM CP for 15 h) cells. The half-life of GFP and c-myc mRNAs was determined relative to β-actin with RT-qPCR and plotted as the mean, considering ‘one phase decay equation’ implemented in GraphPad Prism. Error bars represent SEM, n = 2.
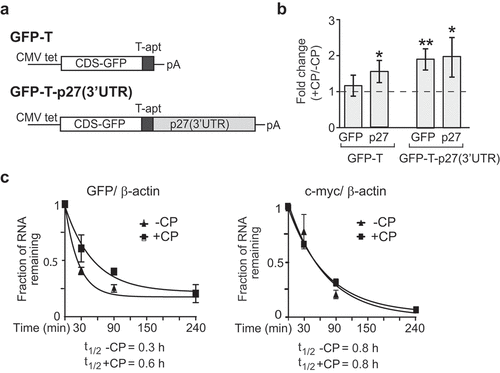
Figure 3. TobTRIP and MS analysis identifies a network of functionally related RBPs bound to p27(3ʹUTR) reporter mRNAs. (a) Schematic representation of tobTRIP for isolation of tagged mRNAs together with bound proteins: In a first step, poly(A) RNA-protein complexes are isolated using oligo(dT)25 beads. In a second step, tobramycin aptamer-tagged RNAs are captured with tobramycin-coupled magnetic beads. (b) Immunoblot analysis of the indicated proteins across different steps of tobTRIP. 1:600 of the extract (input), and 1:60 of the 1st and 2nd step eluates were loaded. A quantification of band intensities across the 2nd step eluates is indicated for ELAV1 and hnRNPD. (c) Differential binding of the 54 proteins interacting with GFP-T-p27(3ʹUTR) in CP-treated (+CP) versus untreated (-CP) cells. Mean LFQ values are plotted against log2-transformed average foldchanges obtained from normalized intensities. (d) GO terms significantly enriched among the 54 selected proteins. Bars indicate the fractions of proteins annotated with the respective GO term, either across proteins pulled-down with the p27(3ʹUTR) reporter (black bars) or across the entire reference proteome (Uniprot; 20,395 proteins; white bars). Absolute numbers of proteins are shown to the right. Adjusted P-values (Benjamini-Hochberg) for enrichments relative to the reference proteome are indicated. (e) PPI network of 28 proteins with multiple and propagating interactions. Each node corresponds to one RBP, and the physical interaction between RBPs is shown as an edge. The thickness of edges is proportional to the STRING confidence score (between 0–1). Node colour corresponds to average log2 fold-change of RNA binding in treated (+CP) versus untreated (-CP) cells as indicated in the colour bar.
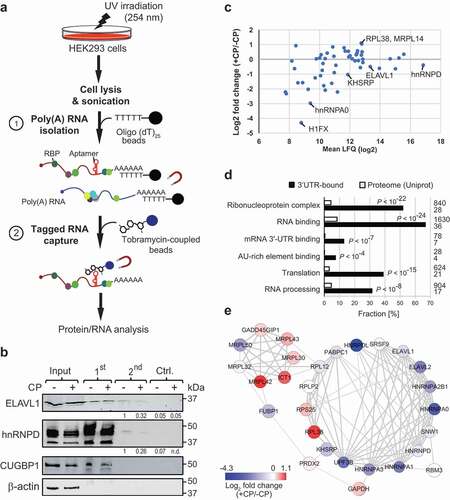
Figure 4. Knock-down of candidate RBPs affect p27 mRNA abundance upon CP treatment in HEK293 cells. (a) Cells were transiently transfected with siRNAs (siKHSRP, sihnRNPD, siPDAP1, siELAVL1, siSNW1) and Scr control oligos for 48 h and treated with 20 µM CP for the last 15 h. P27 mRNA levels of CP-treated (+CP) relative to untreated cells (-CP) was assessed by RT-qPCR and normalized to β-actin (left). P27 protein levels were quantified with immunoblots (right). Error bars represent SEM, n = 3. *P < 0.05, **P < 0.01, ***P < 0.001, two-tailed student’s t-test.
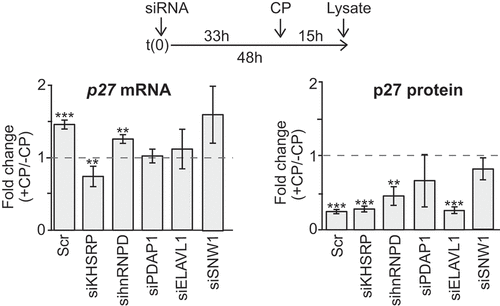
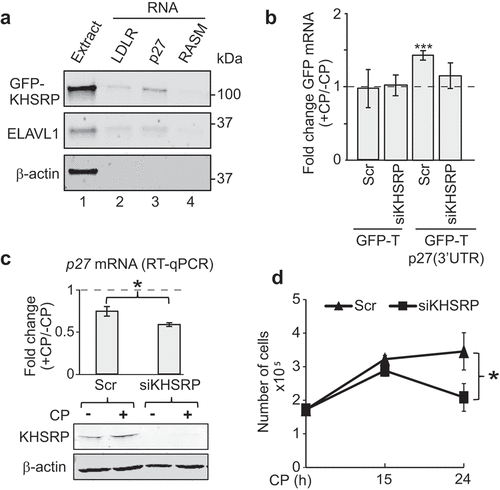
Figure 5. KHSRP affects p27 mRNA abundance via the 3ʹUTR and modulates CP sensitivity of MCF7 cancer cells. (a) Extracts prepared from HEK293 cells expressing GFP-tagged KHSRP (lane 1) were incubated with biotinylated RNAs comprising a fragment containing AREs of the 3ʹUTR of LDRL mRNAs (lane 2), the 3ʹUTR of p27 mRNA (lane 3), and RASM as a negative control (lane 4). RNA was captured with streptavidin beads and monitored for the presence of GFP-KHSRP, ELAVL1 and actin by immunoblot analysis with GFP, ELAVL1, and actin antibodies, respectively. (b) HEK293 cells expressing GFP-T and GFP-T-p27(3ʹUTR) were transiently transfected with siKHSRP or scr (siRNA control) for 48 h and treated with 20 µM CP for the last 15 h. The level of GFP in CP-treated (+CP) versus untreated cells (-CP) was assessed by RT-qPCR normalized to β-actin. (c) MCF7 cells were transiently transfected with siRNAs targeting KHSRP (siKHSRP) and Scr control oligos. P27 mRNA levels of CP-treated (+CP, 24 h) relative to untreated cells (-CP) was assessed by RT-qPCR normalized to β-actin. An immunoblot showing knock-down of KHSRP is depicted below. (d) Cell proliferation of MCF7 cells was determined by Trypan Blue assay at the indicated time points after CP treatment. Error bars represent SEM, n = 3. *P < 0.05, ***P < 0. 001, two-tailed student's t-test.