Figures & data
Figure 1. Viral transcription and tissue inflammation and degeneration in lung and brain of HPAI (H5N1)-experimentally infected ducks.
(A) Relative quantification of HA mRNA in lung and brain (three animals/time point), respectively. The FC in expression was calculated using the 2−∆∆CT method with duck β-actin mRNA as internal reference; the HA mRNA background signal detected in mock infected ducks was arbitrarily assigned the reference value of 1. This figure was adapted with permission from the publisher using data originally published in [Citation24]. (B, C) Semi-quantitative scoring of inflammation (b) and degeneration (c) in lung and brain throughout the time course, based on H&E-stained sections from three animals per time point. Each score consists of the average of subscores evaluating intensity and area involved, with a maximal possible score of 3.5. Data are plotted as the mean (±95% CI of SD) of three animals. The statistical significance of the differences between the two organs in terms of virus transcription at each time point was calculated using unpaired, two-tailed t-test. *P ≤ 0.05; **P ≤ 0.01;***P ≤ 0.001.
![Figure 1. Viral transcription and tissue inflammation and degeneration in lung and brain of HPAI (H5N1)-experimentally infected ducks.(A) Relative quantification of HA mRNA in lung and brain (three animals/time point), respectively. The FC in expression was calculated using the 2−∆∆CT method with duck β-actin mRNA as internal reference; the HA mRNA background signal detected in mock infected ducks was arbitrarily assigned the reference value of 1. This figure was adapted with permission from the publisher using data originally published in [Citation24]. (B, C) Semi-quantitative scoring of inflammation (b) and degeneration (c) in lung and brain throughout the time course, based on H&E-stained sections from three animals per time point. Each score consists of the average of subscores evaluating intensity and area involved, with a maximal possible score of 3.5. Data are plotted as the mean (±95% CI of SD) of three animals. The statistical significance of the differences between the two organs in terms of virus transcription at each time point was calculated using unpaired, two-tailed t-test. *P ≤ 0.05; **P ≤ 0.01;***P ≤ 0.001.](/cms/asset/423cf10a-c119-4d61-9f70-186d1dfba978/krnb_a_1669879_f0001_oc.jpg)
Table 1. Overview of the reads generated by small RNA-seq. of infected and mock-treated duck lung and brain. Values correspond to the average of the 30 libraries per organ representing all time points and replicates.
Figure 2. Overview of the distribution of the four major sncRNA classes in lung and brain of mock- and HPAI H5N1-infected ducks (n = 30 in each organ). (A, B) Distribution of the average number of sncRNA species grouped according to expression level (average normalized read count, CPM). X-axes show ranges of mean expression level (reads), y-axes the number of species of each of the four sncRNA classes within the respective range. (C, D) Global abundance of each sncRNA class based on their average normalized read counts, based on all sncRNA species of >10 CPM/sample. (E) Comparison by sncRNA class of the average number of identified sncRNA species (y-axis) vs average expression level (x-axis), based on all sncRNA species with expression of >10 reads/sample.
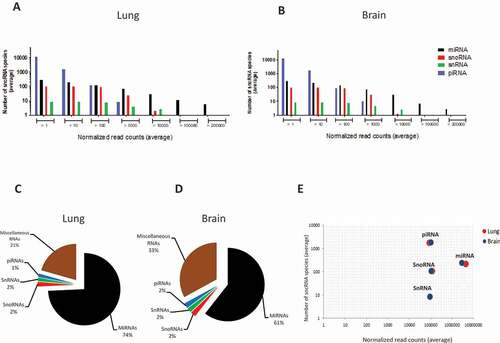
Figure 3. Global reprogramming of sncRNA classes in lung and brain of HPAI H5N1 virus-infected ducks.
Non-metric multidimensional scaling (nMDS) analysis, based on Euclidian distance, was applied to normalized expression values (CPM) of 518 miRNAs, 470 piRNAs (with a mean expression of >10 CPM), 110 snoRNAs, and 10 snRNAs. Each dot is based on the average read count (three biological replicates) of each sncRNA species at the respective time point in lung and in brain. Both organ-specific and infection-driven changes are seen in miRNA, piRNA and snoRNA, but only infection-driven changes in snRNA.
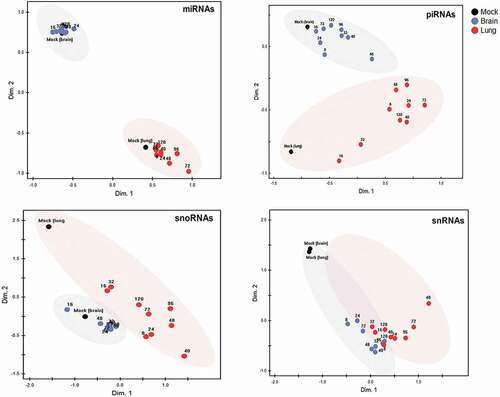
Figure 4. Differential expression patterns of miRNAs in lung and brain of H5N1-infected ducks across the three major phases of infection.
(A) Number of miRNA DE events (i.e. if one miRNA was DE at two time points it was counted as two) in lung and brain at all time points. (B) Number of miRNAs that are DE (regardless of the number of time points) in lung and/or brain. (C, D) Heat maps showing the log2 FC values of the miRNAs that were DE in lung (n = 80) and in brain (n = 18). The red coloured miRNAs refer to those that are DE in both organs (n = 13). The remaining ones in each organs (black coloured miRNAs) are DE uniquely in each organ (lung = 67, brain = 5). Early = 8–24 hpi, middle = 32–48 hpi and late = 72–120 hpi. miRNAs were considered DE if they had log2 FC values > 0 (up-regulated, red coloured cells in the heat maps) or <0 (down-regulated, blue coloured cell in the heat maps) and adjusted P-values <0.05. MiRNAs were named after comparison with miRBase. Several miRNAs are either identical in sequence, but located on different genomic regions, or differ in 1–2 nucleotides and are located in the same genomic region; these were considered the same miRNA and were assigned the same name. MiRNAs that start with ‘KB’ could not be matched with any miRBase entry but were present in Ensemble. Novelmirna are predicted miRNAs that are not present in any of the databases.
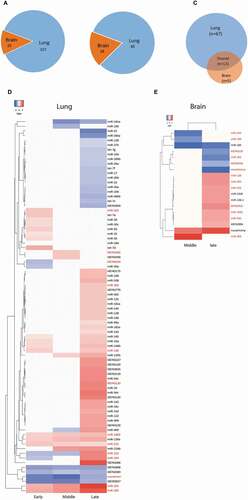
Figure 5. KEGG pathway enrichment predicted to be regulated by miRNAs DE in lung or brain during HPAI (H5N1) infection.
1358 predicted mRNA targets for the 67 miRNA DE in lung and 87 predicted mRNA targets of the 5 miRNA DE only in brain were used as input to retrieve the KEGG pathways enriched in the respective organ (P-value ≤0.05). The degree of enrichment of each KEGG pathway was determined by the percentages of the associated genes (number of the predicted target genes/overall number of gene entities in the corresponding pathway).
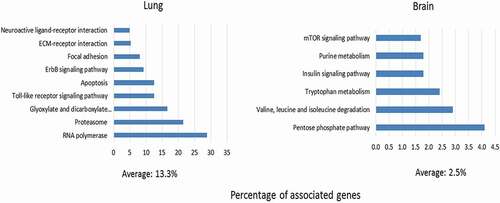
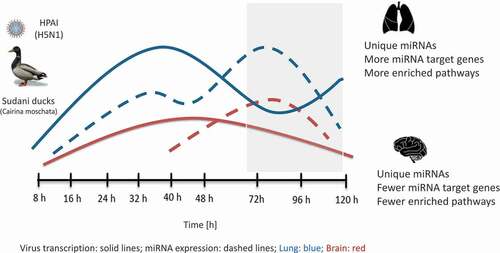
Figure 6. Schematic diagram summarizing the dynamics of HPAI (H5N1) virus and host-encoded miRNA expression in lung and brain of Sudani duck.
Virus transcription rate was higher in lung than in brain. This was followed by miRNA reprogramming, which was higher in lung than in brain and culminated during late infection phase (grey box). This was associated with higher enrichment of KEGG pathways targeted by the DE miRNAs in lung than in brain.