Figures & data
Figure 1. (A) Terminal region of influenza A virus RNA promoter sequence (left) and hp-IAV RNA sequence (right). Red box indicates sequences that mimic the influenza A RNA promoter sequence, which contains two G-U wobble base pairs. (B) Crystal structure of hp-IAV bound to RIG-I ΔCARD. (C) U11 of hp-IAV RNA is proposed to make polar contact with a loop (490–500) of RIG-I ΔCARD (2Fo-Fc map, contour 1.0σ). (D) View of U11 from the top. Atoms N and O in U11 base are located close to the backbone C = O of Q498 and the backbone N-H of Q500 (distance 2.6 and 3.0 Å, respectively).
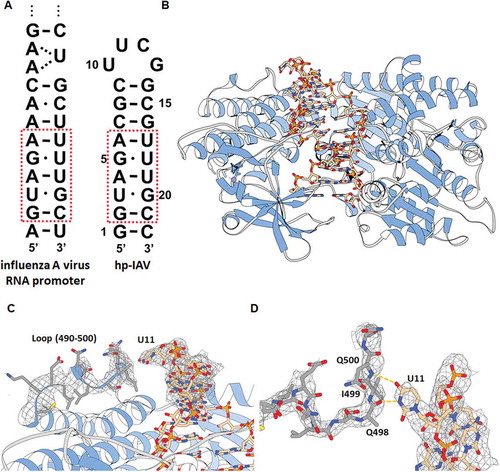
Table 1. Base pair parameters of C1ʹ-C1ʹ distance, angle between the glycosidic bond and C1ʹ-C1ʹ line (λ1, λ2). Helical twist angles (Ωh) with preceding base pairs are also presented. Free indicates the parameters calculated from the crystal structure of hp-IAV only. Bound indicates the parameters calculated from the crystal structure of hp-IAV/RIG-I ΔCARD. All parameters are calculated by w3DNA [Citation31].
Figure 2. (A) 2Fo-Fc electron density map of the crystal structure of hp-IAV RNA (contour 1.0σ). (B) Two different helical conformations of the terminal region of hp-IAV in a single asymmetric unit were aligned. RNAs show a typical A-form helix structure. (C) Hydrogen bonds in base pairs U3-G20, A4-U19, and G5-U18. (D) Helical representation of the first 9 base pairs in free hp-IAV (beige) and RIG-I bound hp-IAV (pink). (E) Base pair stacking and global helical axis in two different state of dsRNA : free hp-IAV (left), RIG-I bound hp-IAV (right).
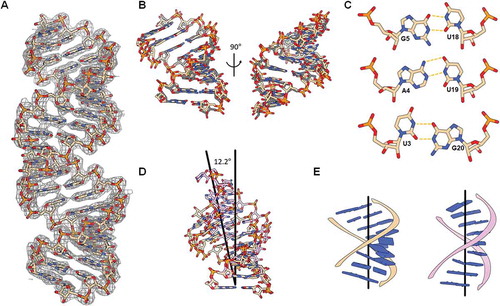
Figure 3. (A) RNAs used in NMR experiments with RIG-I RD. Asterisks indicate where hp-IAV has its G-U wobble base pairs changed to Watson-Crick G-C base pairs (hp-WC). 1D 1H NMR spectrum in the imino proton region (9–15 ppm) of hp-IAV (top) and hp-WC (bottom). (B) Imino proton exchange rates of imino protons in hp-IAV (left) and hp-WC (right). Exchange rates in the free state (white) and the RIG-I RD-bound state (black) were calculated.
Figure 4. Melting curves for three different constructs of RIG-I RD (A), RIG-I ΔCARD (B), and full length RIG-I (C). Each construct was subjected to DSF alone and in complex with 4 different RNAs (hp-IAV, hp-WC, hp-IAV-PS, and hp-WC-PS) at 1.2 times the amount of protein.
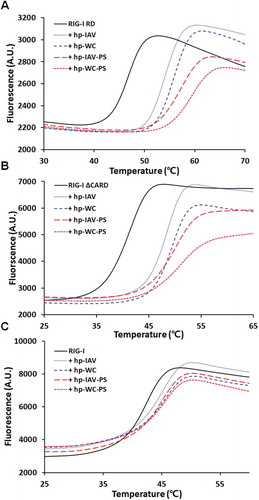
Figure 5. Binding of RIG-I RD to short hairpin RNAs. ITC results of RIG-I RD titration with hp-IAV (A), hp-WC (B), hp-IAV-PS (C), hp-WC-PS (D). Representative thermodynamic parameters (N, KD, ΔH, ΔS) are indicated as mean ± standard deviation.
Figure 6. Relative IFN-β promoter activity in HEK293T cells (black) and RIG-I KO HEK293T cells (grey). Error bars indicate the standard deviation. FLuc expression from the IFN-β promoter was normalized to RLuc expression from the CMV promoter. Experiments were performed in triplicate, and p-values were determined by Student’s t-test. n.s., p > 0.05; **, p ≤ 0.01.