
Figures & data
Figure 1. Sequence Analysis of mCitation5U54-methyltransferase homologs.
Schematic of protein domains in both TRMT2A and TRMT2B. Homologous sequences identified through BLAST searches aligned for key catalytic regions, with the degree of shadowing representing the extent of conservation for a given residue. Nucleophilic cysteine shown in red, Proton extracting glutamate shown in blue. Species that contain only a single predicted mCitation5U54-methyltransferase indicated in blue text. Species that contain a TRMT2B sequence that is predicted to be catalytically inactive are indicated in red text. These two paralogs were analysed for the presence of an N-terminal mitochondrial localization signal (MTS) using computational prediction tools. Higher scores (between 0 and 1) indicate a higher probability of mitochondrial localization, which are also colour coded. NA, not applicable; ND, no data
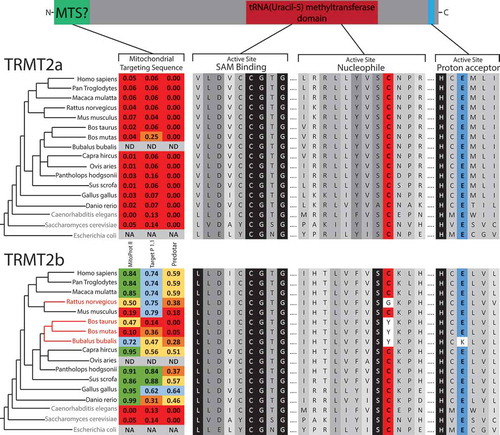
Figure 2. TRMT2B is localized to mitochondria.
TRMT2B-GFP cDNA construct transfected into HeLa cells and detected by fluorescence (top right, green). Nuclei were stained using DAPI (top left, blue). The mitochondrial network was stained using antibodies against the known mitochondrial protein TOM20 (bottom left, red). Colocalisation of TRMT2B and TOM20 appears as yellow in a digitally overlaid image (bottom right).
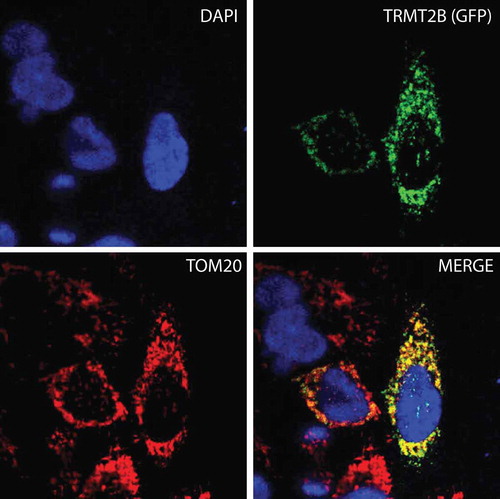
Figure 3. TRMT2B catalyses mCitation5U54 in mt-tRNAPro.
(A) Schematic of mt-tRNAPro T-loop showing annealed primer to be extended (red line) and the position of mCitation5U54 (blue text). HeLa cell derived RNA, either following a 6-day siRNA mediated depletion of TRMT2B or untreated, was subsequently either untreated (-) or treated with hydrazine for either 5 or 10 minutes, followed by aniline, to specifically cleave at unmodified uridine residues. This RNA was subjected to RT-PEx using a [Citation32P]-end labelled primer complementary to the region upstream of mCitation5U54 (red line). The nucleotide sequence of the tRNA, corresponding to stalling events at each position, is shown to the side of the panel. Quantification values represent the ratio between stalling at U54 and stalling at the next uridine residue (U49), after the values in the untreated lanes had been subtracted from both to account for background. (B) RT-PEx reactions as performed above with RNA derived from a HAP1 parental cell line with wild-type (WT) or a HAP1 TRMT2B knockout cell line (KO). Error bars = SEM, n = 3.
![Figure 3. TRMT2B catalyses mCitation5U54 in mt-tRNAPro.(A) Schematic of mt-tRNAPro T-loop showing annealed primer to be extended (red line) and the position of mCitation5U54 (blue text). HeLa cell derived RNA, either following a 6-day siRNA mediated depletion of TRMT2B or untreated, was subsequently either untreated (-) or treated with hydrazine for either 5 or 10 minutes, followed by aniline, to specifically cleave at unmodified uridine residues. This RNA was subjected to RT-PEx using a [Citation32P]-end labelled primer complementary to the region upstream of mCitation5U54 (red line). The nucleotide sequence of the tRNA, corresponding to stalling events at each position, is shown to the side of the panel. Quantification values represent the ratio between stalling at U54 and stalling at the next uridine residue (U49), after the values in the untreated lanes had been subtracted from both to account for background. (B) RT-PEx reactions as performed above with RNA derived from a HAP1 parental cell line with wild-type (WT) or a HAP1 TRMT2B knockout cell line (KO). Error bars = SEM, n = 3.](/cms/asset/c350f0cb-4384-4c83-be4a-690aaa87d348/krnb_a_1712544_f0003_oc.jpg)
Figure 4. TRMT2B catalyses mCitation5U429 in 12S mitochondrial rRNA.
(A) Alignment of the small ribosomal RNA (rRNA) from a range of species in a region corresponding to helix 27 in human 12S mt-rRNA. The degree of shadowing represents the extent of conservation for a given residue, with U429 (or the corresponding position in other species) shown in blue background. The T-loop consensus sequence is displayed above for comparison. (B) Schematic of human 12S mt-rRNA, helix 27, and the location of mCitation5U429 (blue circle). (C) The structure of the human mitoribosome highlighting U429 (blue), the bound mRNA (green), and the adjacently bound tRNA (red). (D) Separation and detection of RT-PEx products using a [Citation32P]-end labelled primer complementary to the region upstream of mCitation5U429 in 12S rRNA. Extension reactions performed on RNA derived from a HAP1 wild-type (WT) and a HAP1 TRMT2B knockout cell line (KO), with or without hydrazine-aniline treatment. The nucleotide sequence of 12S rRNA is shown to the side of the panel. Quantification values represent the ratio between stalling at U429 and stalling at the next uridine residue (U424). Error bars = SEM, n = 4.
![Figure 4. TRMT2B catalyses mCitation5U429 in 12S mitochondrial rRNA.(A) Alignment of the small ribosomal RNA (rRNA) from a range of species in a region corresponding to helix 27 in human 12S mt-rRNA. The degree of shadowing represents the extent of conservation for a given residue, with U429 (or the corresponding position in other species) shown in blue background. The T-loop consensus sequence is displayed above for comparison. (B) Schematic of human 12S mt-rRNA, helix 27, and the location of mCitation5U429 (blue circle). (C) The structure of the human mitoribosome highlighting U429 (blue), the bound mRNA (green), and the adjacently bound tRNA (red). (D) Separation and detection of RT-PEx products using a [Citation32P]-end labelled primer complementary to the region upstream of mCitation5U429 in 12S rRNA. Extension reactions performed on RNA derived from a HAP1 wild-type (WT) and a HAP1 TRMT2B knockout cell line (KO), with or without hydrazine-aniline treatment. The nucleotide sequence of 12S rRNA is shown to the side of the panel. Quantification values represent the ratio between stalling at U429 and stalling at the next uridine residue (U424). Error bars = SEM, n = 4.](/cms/asset/c65874ab-53ba-4179-9078-81493a31071a/krnb_a_1712544_f0004_oc.jpg)
Figure 5. tRNA aminoacylation and stability following the loss of TRMT2B.
(A) High resolution acidic polyacylamide gel electrophoresis (PAGE) northern blot analysis of total RNA extracted from HAP1 wild-type (WT) or TRMT2B knockout cell line (KO). RNA was either maintained in low pH conditions to preserve aminoacylation (Ac), or intentionally deacylated prior to being run on the gel (dAc). The blots were probed with the mt-tRNA-specific riboprobes as indicated, with the tRNAs known to contain mCitation5U54 in red text.(B) High resolution PAGE northern blot analysis of total RNA extracted from HAP1 parental cell line (WT), or a HAP1 TRMT2B knockout cell line (KO), following their growth at 43°C for between 2 and 12 hours. Control cells kept at 37°C shown as ‘0 hrs’. The blots were probed with the mt-tRNA-specific riboprobes as indicated, with the tRNAs known to contain mCitation5U54 in red text. Quantification values were plotted as a percentage of the untreated 0 hr RNA. (C) As above following exposure to 250 μg/mL ethidium bromide (EtBr) for between 6 and 36 hours. Control cells grown in media containing no EtBr shown as ‘0 hrs’. The blots were probed with the mt-tRNA-specific riboprobes as indicated, with the tRNAs known to contain mCitation5U54 in red text. Quantification values were plotted as a percentage of the untreated 0 hr RNA, after they had been normalized to 5S to control for RNA loading.
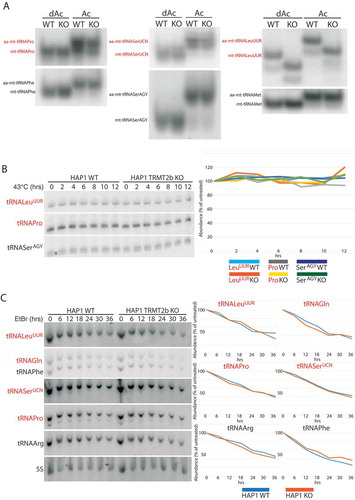
Figure 6. Mitoribosome integrity following the loss of TRMT2B.
(A) Western blot using lysates derived from HAP1 WT and KO probed using antibodies against three protein components on the small subunit. Coomassie gel staining shown as loading control. (B) Northern blot analysis of total RNA extracted from HAP1 parental cell line (WT), or a HAP1 TRMT2B knockout cell line (KO). (C) Northern blot analysis of total RNA extracted from HAP1 WT and TRMT2B KO cell lines following their growth at 43°C for between 2 and 12 hours. Quantification values plotted as the ratio between 12S and 16S. (D) Northern blot analysis of total RNA extracted from HAP1 WT and TRMT2B KO cell lines following their exposure to 250 μg/mL ethidium bromide (EtBr) for between 2 and 12 hours.
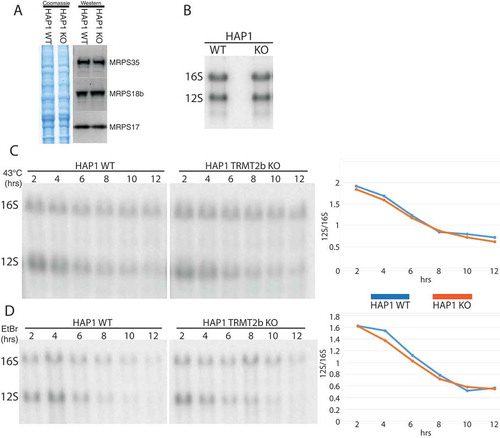
Figure 7. Mitochondrial translation following the loss of TRMT2B.
(A) Western blot analysis of steady-state levels of OXPHOS subunits in HAP1 parental cell line (WT), and the HAP1 TRMT2B knockout cell line (KO). (B) Assessment of de novo mitochondrial protein synthesis through [Citation35S]-methionine incorporation in the HAP1 WT and KO cell lines. Coomassie gel staining was used as a control for protein loading. (C) Growth curves obtained by Incucyte kinetic imaging system of HAP1 WT and KO cell lines. Cells were grown for 140 hours in the presence of ‘high’ (4.5 g/L) or ‘low’ (1 g/L) glucose.
![Figure 7. Mitochondrial translation following the loss of TRMT2B.(A) Western blot analysis of steady-state levels of OXPHOS subunits in HAP1 parental cell line (WT), and the HAP1 TRMT2B knockout cell line (KO). (B) Assessment of de novo mitochondrial protein synthesis through [Citation35S]-methionine incorporation in the HAP1 WT and KO cell lines. Coomassie gel staining was used as a control for protein loading. (C) Growth curves obtained by Incucyte kinetic imaging system of HAP1 WT and KO cell lines. Cells were grown for 140 hours in the presence of ‘high’ (4.5 g/L) or ‘low’ (1 g/L) glucose.](/cms/asset/6a75a129-d966-4b28-bc10-f0a245b4f845/krnb_a_1712544_f0007_oc.jpg)