
Figures & data
Figure 1. Miniscreen of potential mHTT mRNA-interacting RBPs that modulate HTT levels.
(A) The list of potential HTT mRNA interacting RBPs based on the CLIP-seq data analysed in StarBase (ref. [Citation12]). These candidates were then checked for brain tissue expression at BioGPS (ref. [Citation13]). The ‘# of target sites’ indicate the number of potential RBP-bound sequences detected in the HTT mRNA. The RBPs that are expressed in the brain with the ‘# of target sites’ >5 were prioritized for further testing (white rows). eIF4AIII was deprioritized since it is a translation initiation factor and may have non-specific effects.(B) mHTT levels in the HD patient fibroblasts were tested by HTRF using the 2B7/MW1 antibody pair. Two different lines (Q45 and Q68) were transfected with the pooled siRNA targeting the indicated RBPs. Bars indicate mean and SEM (4 biological replicates).The statistical analysis was performed by one-way ANOVA with the Dunnett’s post hoc tests. ****P < 0.0001, **P < 0.001.
![Figure 1. Miniscreen of potential mHTT mRNA-interacting RBPs that modulate HTT levels.(A) The list of potential HTT mRNA interacting RBPs based on the CLIP-seq data analysed in StarBase (ref. [Citation12]). These candidates were then checked for brain tissue expression at BioGPS (ref. [Citation13]). The ‘# of target sites’ indicate the number of potential RBP-bound sequences detected in the HTT mRNA. The RBPs that are expressed in the brain with the ‘# of target sites’ >5 were prioritized for further testing (white rows). eIF4AIII was deprioritized since it is a translation initiation factor and may have non-specific effects.(B) mHTT levels in the HD patient fibroblasts were tested by HTRF using the 2B7/MW1 antibody pair. Two different lines (Q45 and Q68) were transfected with the pooled siRNA targeting the indicated RBPs. Bars indicate mean and SEM (4 biological replicates).The statistical analysis was performed by one-way ANOVA with the Dunnett’s post hoc tests. ****P < 0.0001, **P < 0.001.](/cms/asset/c05cbdaa-50e2-4142-a950-79ff9e91ded6/krnb_a_1712894_f0001_oc.jpg)
Figure 2. HuR modulates HTT mRNA levels in a mHTT dependent manner.
(A) RT-qPCR measurements of HuR and HTT mRNA level in wild-type (STHdhQ7/Q7) or HD (STHdhQ7/Q111) mouse striatal cells transfected with the siRNAs targeting HuR (HuR_siRNA 1 and HuR_siRNA 2) or with the non-targeting control siRNA (Neg_siRNA) for 48 hours (12 technical replicates from 3 biological replicates). All signals were normalized to the averaged signal of Neg_siRNA transfected controls.(B) Similar to (A), but in immortalized human wild-type (Q16) or HD (Q47) fibroblasts (12 technical replicates from 3 biological replicates).(C) HTRF measurements of HTT protein levels in the HuR siRNA or the non-targeting control siRNA (Neg_siRNA) transfected wild-type or HD cells (12 technical replicates from 3 biological replicates for STHdh cells, and 16 technical replicates from 4 biological replicates for immortalized human fibroblasts). The siRNAs were transfected for 72 hours. All signals were normalized to the Neg_siRNA transfected controls. Note that the HTRF antibody pair 2B7/2166 was used here to detect the total HTT (including mHTT and wild-type HTT proteins) levels, different from the mHTT-specific antibody pair used for .(D) RT-qPCR measurements of HuR and mouse HTT (msHTT) mRNA levels in the HD mouse striatal cells (STHdhQ7/Q111) transfected with cDNA plasmids expressing human HuR. All signals were normalized to the averaged signal of the empty vector transfected control group (mock) (12 technical replicates from 3 biological replicates). Note that the HuR mRNA measurement in the mock group utilized the mouse HuR qPCR primers, whereas the one in the HuR transfected group utilized human HuR qPCR primers. Since these two set of primers had similar efficiency (Fig. S5) and the same threshold was used for analysis, the comparison between these two groups is valid.(E) RT-qPCR measurements of HuR and mouse HTT (msHTT) mRNA level in the wild-type mouse striatal cells (STHdhQ7/Q7). The cells were transfected with the siRNAs targeting HuR or the non-targeting control siRNA (Neg_siRNA), and then after 24 hours with cDNA plasmids expressing human wild-type full-length HTT (hsHTT-Q23), mutant HTT exon1 (hsHTTexon1-Q72) or full-length (hsHTT-Q73) (12 technical replicates from 3 biological replicates). The mRNA levels were then measured 48 hours after cDNA transfection. All the signals were normalized to the averaged signals of the Neg_siRNA transfected control groups.For all plotted data, error bars represent mean and SEM. The statistical analysis was performed by one-way ANOVA and post-hoc Dunnett’s tests for A-C, and two-tailed unpaired t tests for D-E. **P < 0.01; ****P < 0.0001; n.s., P > 0.05.
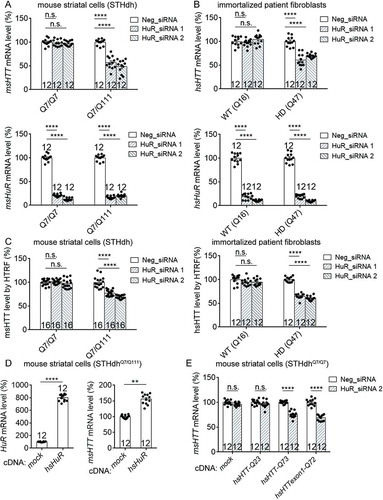
Figure 3. Lowering HuR by siRNA knockdown or CRISPR heterozygous knockout decreased HTT mRNA stability in HD cells.
(A) HuR mRNA (left) and HTT mRNA (right) stability measurements in HD mouse striatal cells (STHdhQ7/Q111) (12 technical replicates from 3 biological replicates). Cells were transfected with indicated siRNAs for 36 hours, then treated with actinomycin D to stop new mRNA synthesis. HuR and HTT mRNA levels were then measured at different time points as indicated on the X-axis. The levels were then normalized to ms18S mRNA levels and plotted as the percentage of the time 0. Data values (mean ± S.E.M.) have been indicated for each point.(B) Similar to (A), but in immortalized HD patient fibroblasts (Q47) (12 technical replicates from 3 biological replicates). Data values (mean ± S.E.M.) have been indicated for each point.(C) Left panel: A representative Western-blot of HuR in HD mouse striatal cells (STHdhQ7/Q111) with or without HuR knocked out by the CRISPR system. α-Actin was blotted as a loading control. The sequencing chromatograms also verified the heterozygous knockout of HuR from the population (lower panel). Right panel: similar to A, but in HuR± or HuR+/+ STHdhQ7/Q111 cells without siRNA transfections (12 technical replicates from 3 biological replicates). Data values (mean ± S.E.M.) have been indicated for each point.For all plotted data, error bars represent mean and SEM. The statistical analysis was performed by two-way ANOVA, except the middle panel of C, which was analysed by two-tailed unpaired t tests. ***P < 0.001; ****P < 0.0001.
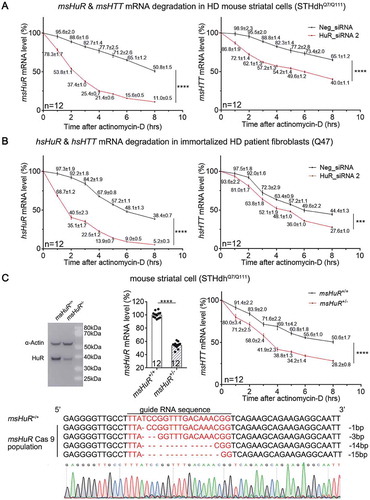
Figure 4. HuR interacts with HTT mRNA in the HD cells, likely in the protein-coding region of HTT.
(A) A list of potential HuR’s binding sites in human HTT (hsHTT) mRNA based on StarBase (ref. [Citation12]). The highlighted lines indicate a candidate site (#105708) that has conserved sequences in human and mouse. ‘AU-rich’ indicates a site that is not listed in StarBase, but is still a possible interaction site predicted by HuR preferred binding sequences (ARE).(B) RT-qPCR quantifications of HuR-bound HTT mRNA levels in HD mouse striatal cells (STHdhQ7/Q111) or immortalized HD patient fibroblasts (Q47) as well as the wild-type controls (STHdhQ7/Q7 and Q16) by RNA-IP (12 technical replicates from 3 biological replicates). IgG was used as a negative control for the IP, and the 18S level was quantified as a baseline control to normalize the signals.(C) RT-qPCR quantifications of HuR-bound exogenously expressed human HTT (hsHTT) mRNA levels in WT mouse striatal cells (STHdhQ7/Q7) transfected with cDNA plasmids expressing full-length wild-type human HTT (hsHTT-Q23), full-length mutant HTT (hsHTT-Q73) or exon1 of mutant HTT (hsHTTexon1-Q72) by RNA-IP (12 technical replicates from 3 biological replicates). IgG was used as a negative control for the IP, and the 18S level was quantified as a baseline control to normalize the signals.(D) RT-qPCR quantifications of the exogenously expressed human HTT mRNA level in wild-type mouse striatal cells (STHdhQ7/Q7) transfected with the HuR siRNA or the non-targeting control siRNA (Neg_siRNA). The cDNA plasmids expressing exon1 (hsHTTexon1-Q72) or full-length (hsHTT-Q73) of human mutant HTT mRNA were transfected 24 hours after siRNA transfection, and their levels were measured after another 48 hours (12 technical replicates from 3 biological replicates).For all plotted data, error bars represent mean and SEM. The statistical analysis was performed by two tailed unpaired t tests, ****P < 0.0001; n.s.: P > 0.05.
![Figure 4. HuR interacts with HTT mRNA in the HD cells, likely in the protein-coding region of HTT.(A) A list of potential HuR’s binding sites in human HTT (hsHTT) mRNA based on StarBase (ref. [Citation12]). The highlighted lines indicate a candidate site (#105708) that has conserved sequences in human and mouse. ‘AU-rich’ indicates a site that is not listed in StarBase, but is still a possible interaction site predicted by HuR preferred binding sequences (ARE).(B) RT-qPCR quantifications of HuR-bound HTT mRNA levels in HD mouse striatal cells (STHdhQ7/Q111) or immortalized HD patient fibroblasts (Q47) as well as the wild-type controls (STHdhQ7/Q7 and Q16) by RNA-IP (12 technical replicates from 3 biological replicates). IgG was used as a negative control for the IP, and the 18S level was quantified as a baseline control to normalize the signals.(C) RT-qPCR quantifications of HuR-bound exogenously expressed human HTT (hsHTT) mRNA levels in WT mouse striatal cells (STHdhQ7/Q7) transfected with cDNA plasmids expressing full-length wild-type human HTT (hsHTT-Q23), full-length mutant HTT (hsHTT-Q73) or exon1 of mutant HTT (hsHTTexon1-Q72) by RNA-IP (12 technical replicates from 3 biological replicates). IgG was used as a negative control for the IP, and the 18S level was quantified as a baseline control to normalize the signals.(D) RT-qPCR quantifications of the exogenously expressed human HTT mRNA level in wild-type mouse striatal cells (STHdhQ7/Q7) transfected with the HuR siRNA or the non-targeting control siRNA (Neg_siRNA). The cDNA plasmids expressing exon1 (hsHTTexon1-Q72) or full-length (hsHTT-Q73) of human mutant HTT mRNA were transfected 24 hours after siRNA transfection, and their levels were measured after another 48 hours (12 technical replicates from 3 biological replicates).For all plotted data, error bars represent mean and SEM. The statistical analysis was performed by two tailed unpaired t tests, ****P < 0.0001; n.s.: P > 0.05.](/cms/asset/579872b1-be76-4257-97a2-d76f29ae23b4/krnb_a_1712894_f0004_oc.jpg)
Figure 5. HuR interacts with #105708 site in exon 11 of the HTT mRNA.
(A) RT-qPCR quantifications of HuR-bound exogenously expressed HTT mRNA 5ʹ fragment (exon 1–10 or exon 1–11) levels in the wild-type mouse striatal cells (STHdhQ7/Q7) by RNA-IP (12 technical replicates from 3 biological replicates). IgG was used as a negative control for the IP, and the 18S level was quantified as a baseline control to normalize the signals. HuR interacted with exon 1–11 but not exon 1–10, suggesting that exon 11 contains the HuR-binding site.(B) Similar to (A), but in HD cells (STHdhQ7/Q111) transfected with cDNA plasmids expressing EGFP mRNAs containing different candidate binding sites in its 3ʹ UTR region (12 technical replicates from 3 biological replicates). The EGFP mRNA with #105708 site sequences (mouse or human) showed interaction with HuR, suggesting that #105708 (located in exon 11 of HTT mRNA) is a potential HuR-binding site.(C) A representative R-EMSA gel image of different Cy3-labelled RNA oligos of potential binding site sequences after co-incubation with purified HuR-MBP.His proteins (see Fig. S3). The first lanes in each group were loaded by the indicated RNA oligos alone. In the 2nd and 3rd lanes in each group, the indicated RNA oligos were incubated and loaded with purified HuR-MBP.His protein at different concentration ratios as indicated. Five repeats were performed, showing consistent results. HuR-binding with the RNA oligo leads to an apparent molecular weight shift to the top (dark arrows), due to mobility block caused by protein-binding.(D) Quantification of the ratio between firefly luciferase and renilla luciferase signals in HD mouse striatal cells (STHdhQ7/Q111) transfected with the pmirGLO reporter plasmids (12 technical replicates from 3 biological replicates). The firefly/renilla signal ratio is an indicator of the level of firefly luciferase mRNA, of which the 3ʹ UTR region contained different sequences of potential HuR-binding sites. The HuR knockdown by siRNA caused lowering of the firefly/renilla signal ratio only for #105708-containing plasmids, suggesting that #105708 is likely a functional binding site.(E) RT-qPCR quantifications of HuR-bound endogenous mouse HTT (msHTT) mRNA levels in HD mouse striatal cells (STHdhQ7/Q111) transfected with pmirGLO plasmids expressing firefly luciferase mRNAs containing different potential binding sites (12 technical replicates from 3 biological replicates). The mRNAs with functional binding sites may compete with endogenous msHTT mRNA for HuR binding (illustrated in the schematic picture in the left panel). Thus, the RNA-IP signals of the corresponding samples could be reduced (right panel). IgG was used as a negative control for the IP, and the 18S level was quantified as a baseline control to normalize the signals.For all plotted data, error bars represent mean and SEM. The statistical analysis was performed by two-tailed unpaired t tests, ****P < 0.0001; n.s.: P>0.05.
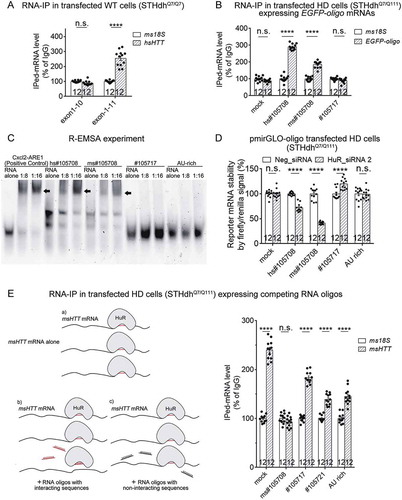
Figure 6. HuR interacts with HTT mRNA in an mHTT-dependent manner.
(A) RT-qPCR quantifications of the levels of endogenous mouse HTT (msHTT) mRNA bound with HuR in WT mouse striatal cells (STHdhQ7/Q7) transfected with empty vector (mock) or cDNA plasmids expressing full-length (hsHTT-Q73) or exon 1 (hsHTTexon1-Q72) by RNA-IP (12 technical replicates from 3 biological replicates). IgG was used as a negative control for the IP, and the 18S level was quantified as a baseline control to normalize the signals.(B) Similar to , but in wild-type cells (STHdhQ7/Q7) (7 biological replicates).(C) Similar to , but in wild-type cells (STHdhQ7/Q7) transfected with hsHTTexon1-Q72 plasmid 24 hours before transfection of the pmirGLO reporter plasmids with the indicated potential binding sites (6 biological replicates).o-tailed unpaired t tests, ****P < 0.0001; n.s.: P > 0.05.For all plotted data, error bars represent mean and SEM. The statistical analysis was performed by two-tailed unpaired t tests. **P < 0.01; ****P < 0.0001; n.s., P > 0.05.
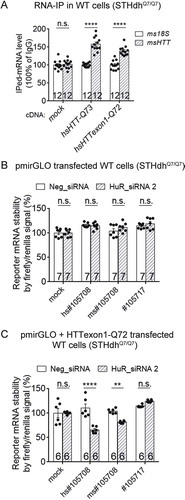
Figure 7. The nuclear/cytoplasmic distribution of HuR protein in wild-type versus HD cells or tissues.
(A) Representative Western-blots (from 4 biological replicates) of HuR protein levels in the nuclear or cytoplasmic fractions of wild-type (STHdhQ7/Q7) or HD (STHdhQ7/Q111) mouse striatal cells. β-Tubulin was blotted as a cytoplasmic loading control, and Lamin A/C as a nuclear loading control. These two control proteins were only detected in their localized fractions, confirming reliable nuclei/cytoplasm separation. The cytoplasmic/nuclear ratios of HuR signals were quantified and plotted (8 technical replicates from 4 biological replicates).(B) Similar to (A), but in the cytoplasmic and nuclear fractions of striatal tissue lysates from 6.5-month-old wild-type (HdhQ7/Q7) or HD (HdhQ140/Q140) mice (8 technical replicates from 4 biological replicates).(C) Representative images and quantifications of immunofluorescent staining of the distribution of HuR protein in wild-type (STHdhQ7/Q7) or HD (STHdhQ7/Q111) cells. The cytoplasmic/nuclear ratios of HuR signals were quantified for each cell and presented by beanplot (4 biological replicates with more than 10,000 cells for each replicate).(D) RT-qPCR quantifications of HuR-bound HTT mRNA levels in nuclear and cytoplasmic fractions of HD (STHdhQ7/Q111) or wild-type (STHdhQ7/Q7) cells detected by RNA-IP (12 technical replicates from 3 biological replicates). IgG was used as a negative control for the IP, and the 18S level was quantified as a baseline control to normalize the signals.For all plotted data, error bars represent mean and SEM. For all bean plots, the long black solid line represents the mean of each replicate, the grey dashed line represents the mean of all data points, the grey area represents the distribution of data, and short black solid lines represent the outliers of original data. The statistical analysis was performed by two-tailed unpaired t tests, ***P < 0.001, ****P < 0.0001; n.s., P > 0.05.
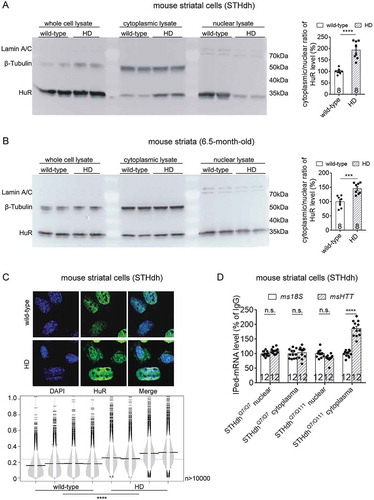
Figure 8. MAPK11 is an upstream modulator of HuR and controls HuR’s regulation of HTT mRNA levels in HD cells.
(A) RT-qPCR quantifications of endogenous msHTT mRNA levels in HD mouse striatal cells (STHdhQ7/Q111) transfected with the indicated siRNAs (12 technical replicates from 3 biological replicates). msMAPK11 siRNA (grey bars) or the non-targeting control siRNA (Neg_si, white bars) were co-transfected with HuR siRNA (HuR_si) or the non-targeting control siRNA (Neg_si). msHTT mRNA levels were measured 48 hours after transfection.(B) HTT mRNA degradation measurements in HD mouse striatal cells (STHdhQ7/Q111) transfected with the indicated siRNAs for 36 hours, and then treated with actinomycin D (12 technical replicates from 3 biological replicates). The quantification of HTT mRNA degradation was then performed the same as in . Data values (mean ± S.E.M.) have been indicated for each point.(C) Similar to (B), but in immortalized human HD fibroblast (Q47) (12 technical replicates from 3 biological replicates). Data values (mean ± S.E.M.) have been indicated for each point.(D) Similar to (B), but in pooled colonies of mouse HD cells (STHdhQ7/Q111) with the heterozygous knockout of HuR (12 technical replicates from 3 biological replicates). Data values (mean ± S.E.M.) have been indicated for each point.For all plotted data, error bars represent mean and SEM. The statistical analysis was performed by two-way ANOVA (B-D) or two-tailed unpaired t tests (A). ****P < 0.0001; n.s., P > 0.05.
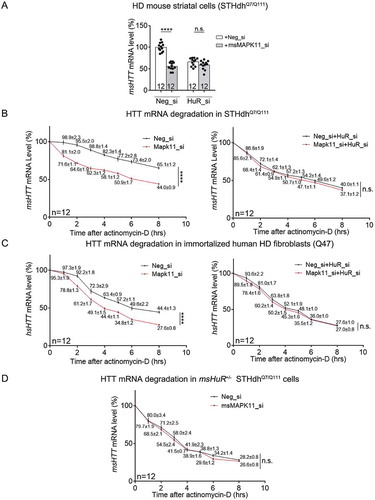
Figure 9. MAPK11 regulated nuclei/cytoplasm distribution of HuR protein in HD cells or tissues.
(A) Representative Western-blots and quantifications of cytoplasmic versus nuclear HuR protein levels in the HD mouse striatal cells (STHdhQ7/Q111) transfected with the indicated siRNAs (8 technical replicates from 4 biological replicates).(B) Representative Western-blots and quantifications of cytoplasmic versus nuclear HuR protein levels in the lysates of striatal tissues from 6.5-month-old HD (HdhQ140/Q140) mice with or without msMAPK11 knockout (8 technical replicates from 4 biological replicates).(C) Similar as , but in HD (STHdhQ7/Q111) cells transfected with the indicated siRNAs (4 biological replicates).(D) Similar as in , but using HD cells transfected with the indicated siRNAs (12 technical replicates from 3 biological replicates). IgG was used as a negative control for the IP, and the 18S level was quantified as a baseline control to normalize the signals.For all plotted data, error bars represent mean and SEM. For all bean plots, the long black solid line represents the mean of each replicate, the grey dashed line represents the mean of all data points, the grey area represents the distribution of data, and short black solid lines represent the outliers of original data. The statistical analysis was performed by two-tailed unpaired t tests, ****P < 0.0001; n.s., P > 0.05.
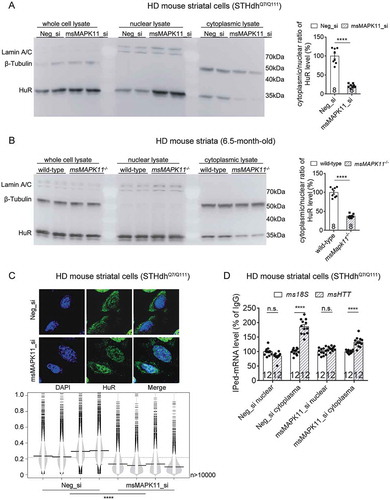
Figure 10. A schematic model illustrating mHTT-dependent MAPK11-HuR mediated regulation of HTT mRNA stability.
The presence of mHTT activates MAPK11 (ref. [Citation19,Citation20]), leading to translocation of HuR protein to the cytoplasm (ref. [Citation21]) ( & ) and its interaction with HTT mRNA in its exon 11 at the #105708 site ( & ) to stabilize it in a mHTT-dependent manner (, & ).
![Figure 10. A schematic model illustrating mHTT-dependent MAPK11-HuR mediated regulation of HTT mRNA stability.The presence of mHTT activates MAPK11 (ref. [Citation19,Citation20]), leading to translocation of HuR protein to the cytoplasm (ref. [Citation21]) (Figs. 7 & 9) and its interaction with HTT mRNA in its exon 11 at the #105708 site (Figs. 4 & 5) to stabilize it in a mHTT-dependent manner (Figs. 2, 6 & 8B–D).](/cms/asset/78ed62cb-d2ac-445f-b0ca-ba3144e54add/krnb_a_1712894_f0010_oc.jpg)
Supplemental Material
Download Zip (2.1 MB)Data availability
The CLIP-seq data analysis results were obtained from the previously published database StarBase, which is available at: http://starbase.sysu.edu.cn/;
The RBP expression was analyzed by the BioGPS database, which is available at: http://biogps.org/#goto=welcome
The accession numbers of the genes relevant to this study include:
HTT-huntingtin [Homo sapiens] (hsHTT): Gene ID 3064
Htt-huntingtin [Mus musculus] (msHTT): Gene ID 15194
ELAVL1-HuR [Homo sapiens] (hsHuR): Gene ID 1994
Elavl1-HuR [Mus musculus] (msHuR): Gene ID 15568
MAPK11 [Homo sapiens] (hsMAPK11): Gene ID 5600
Mapk11 [Mus musculus] (msMAPK11): Gene ID 19094
All the gene information is available at: https://www.ncbi.nlm.nih.gov/gene