
Figures & data
Figure 1. Identification of circRNA in chicken spleens. (a) The distribution of host genes encoding different number of novel circRNAs in chicken spleens. (b) The proportion of different categories of circRNAs in chicken spleens. Most of circRNAs were derived from exon regions of their host genes while a few circRNAs were formed by circularization of intronic or intergenic sequences. (c) The distribution of novel circRNAs in different chromosomes. Huge chromosomes produced more circRNAs in chicken genome. (d) Cumulative distribution of circRNA length (left) and expression (right). Three different types of circRNAs showed no significant changes in length and expression abundance (TPM). (e) Box plot showing the length of flanking introns of circRNAs’ host exon and the other exons. Introns surrounding circRNAs’ host exon significantly larger than that of other spliced exons. (f) Over-representation test showed that simple repeats and interspersed repeats were significantly enriched in circRNA flanking introns (p < 0.01, fisher exact test). Moreover, by employing alignment in each circRNA flanking intron pair, over 80% of RCMs contained chicken repeat 1 family (left). (g) The genomic regions of RUNX2. (h) The RCM in the long intron flanking sequences of the upstream of exon 2 and the downstream of exon 4.
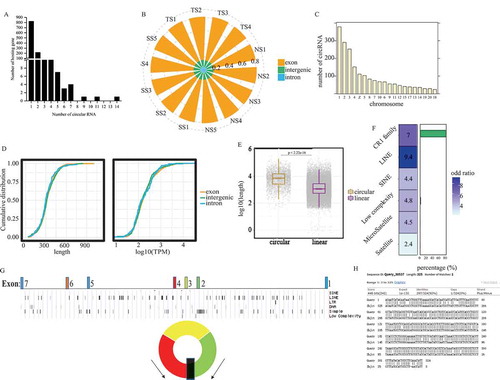
Table 1. The specific information of 18 circRNAs.
Figure 2. Expressional profile of circRNAs. (a) Expression correlation between circRNAs and their respective parental genes. Reads that spanned junction site reads (JSRs) were compared between circular and linear RNAs. (b) Expression variance of circRNAs and their parental genes in three groups. (c) Heatmap showing the expression of all circRNAs identified in this research. Read counts of each circRNAs were scaled into Z score. (d) Number of differentially expressed circRNAs in three different contrasts. (e) Volcano plots depicting differentially expressed circRNAs in three contrasts. The horizontal dashed lines represent the adjusted p value cut-off of 0.01 and the perpendicular dashed lines represent |LFC| cut-off of 1.
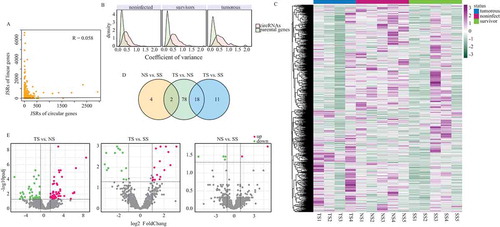
Figure 3. GO enrichment of host genes of differentially expressed circRNAs. Directed acyclic graph (DAG) described the significant biological processes and molecular functions of DE circRNAs in TS vs. NS contrast (a) and TS vs. SS contrast (b).
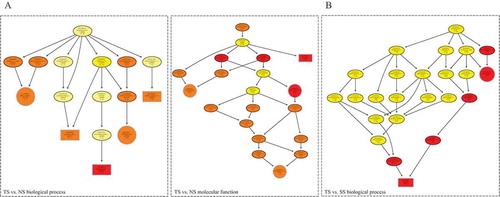
Figure 4. Experimental validation of circular RNAs. (a) Divergent primers and convergent primers were used to amplify circRNAs in cDNA and genomic DNA (gDNA). Black triangles represent divergent primers white triangles represent convergent primers. (b) Sanger sequencing confirmed the back-splicing junction sequence of circRNAs.
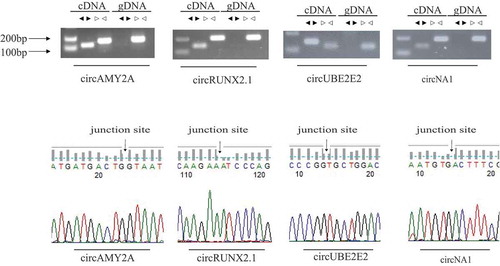
Figure 5. Validation of the gene expression profile by real-time PCR. Six circRNAs were detected by Q-PCR. X-axis represents gene name, y-axis represents log2foldchange, black column represents expression data from RNA-Seq, light grey column means expression data from Q-PCR.
Figure 6. The resistance of circRNAs to Rnase R digestion. (a) The expression of β-actin and parental genes of circRNAs with or without Rnase R treatment. (b) The expression of β-actin and circRNAs with or without Rnase R treatment. R+ represents that the RNA was digested by Rnase R, R- represents that RNA without digested by Rnase R. **means p < 0.01.
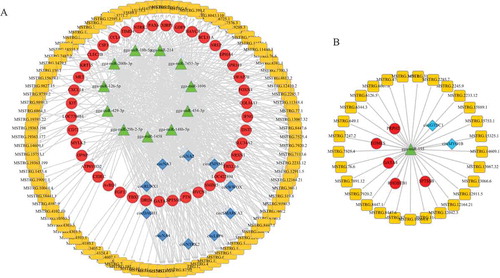
Figure 7. Regulatory network of circRNA/lncRNA-miRNA-mRNA pairs in chicken spleens with Marek’s disease virus infection. (a) Interaction network of DE lncRNAs, circRNAs and mRNA. (b) Interaction network of miR-155 and its potential target lncRNAs, circRNAs and mRNAs.
Supplemental Material
Download Zip (7.8 MB)Data availability
All data of this study are included in this published article and its supplementary information files. RNA-seq data are available at NCBI Gene Expression Omnibus (GEO, GSE138601 and GSE138600).
CircRNA data (GSE138600) are available at: (https://www.ncbi.nlm.nih.gov/geo/query/acc.cgi?acc=GSE138600), miRNA data (GSE138601) are available at: (https://www.ncbi.nlm.nih.gov/geo/query/acc.cgi?acc=GSE138601).