
Figures & data
Figure 1. Intracellular localization of FL RNA after NXF1 and/or CRM1 inhibition. (A) Schematic representation of the plasmids used in the experiments. MS2 stem loops insertion and γCTE deletion are shown. The fluorescent probes used to specifically detect the FL RNA are marked in green. (B) Western blotting of protein extracted from NIH3T3 cells transfected with the different constructs and from purified virions. The expressions of Gag (65 kDa) and Actin (42 kDa) are shown. (C) Representative images of MS2-tagged RNA (green) detected by sm-FISH in cells expressing WT or ∆γCTE MLV, treated or not with LMB. The nuclei are stained with DAPI (blue). For each cell, at least 11 stacks were taken and the image resulted from the sum of all stacks for each condition (D) Values of nuclear FL RNA levels are presented as the mean ± SEM of 86 cells from at least three independent transfections. The significance of differences between conditions was assessed using an unpaired Student’s t-test (****P ≤ 0.0001).
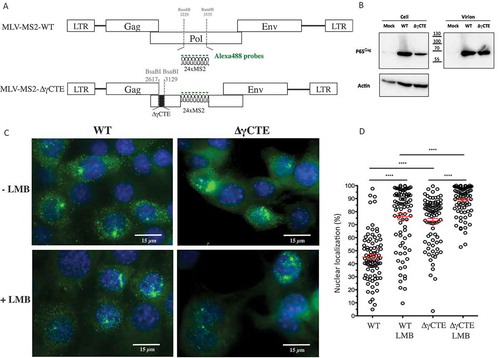
Figure 2. Impact of CRM1 on MLV translation. (A) Gag protein analysis. NIH3T3 cells chronically infected with MLV were treated or not with LMB. The expressions of Gag (65 kDa), Capsid (30 kDa) and Actin (42 kDa) are shown. The blot is a representative experiment among three independent assays. Band integrated densities were determined with the ImageJ software and normalized to Actin. Intensities are presented in the histogram as mean +/− SEM and the significance of differences with control (MLV-LMB) was assessed using an unpaired student’s t-test (*P ≤ 0.05). (B) Effect of LMB on MLV transcription in cells. Intracellular FL RNA levels were specifically determined by RT-qPCR and normalized to the copy numbers of GAPDH mRNA. Percentages are given in graph and are not significantly distinct between ± LMB as assessed by unpaired student’s t-test (nsP > 0.05).
Figure 3. Impact of CRM1 pathway on packaging of viral reporter RNA. (A) Schematic representation of the plasmids used in microscopy experiments of panel b. Reporter-MS2 plasmids express a viral MS2-tagged RNA reporter harbouring wild-type (WT) or deleted (∆Psi) MLV packaging signal. Cy3-labelled probes used in sm-FISH which interact specifically with MS2 stem loops, are shown. MLV splice donor and acceptor sites (SD and SA, respectively) are drawn. MLV Gag proteins fused to GFP are expressed in trans by the pCAG-GAG-GFP vector. (B) Representative image of virus sample obtained by sm-FISH. Bottom left image corresponds to zoom in area of the image (white square). Gag with RNA corresponds to red-green dots colocalization. The graph shows the calculated ratios of colocalized red-green dots/total green dots. Percentages are presented as mean ± SEM and the significance of differences was assessed using an unpaired student’s t-test (****P ≤ 0.0001 and ***P ≤ 0.001). More than 1500 viral like-particles were analysed per condition. (C) Effects of LMB on the packaging of native FL RNA in infectious context. Chronically infected NIH 3T3 cells were treated or not with LMB and RNA analyses conducted by RT-qPCR as described in materials and methods. The packaging efficiency was calculated as the ratio of cellular FL RNA copies/FL RNA copies in virus. Percentages are presented as mean ± SEM and the significance of differences with control (MLV WT) was assessed using an unpaired student’s t-test (****P ≤ 0.0001).
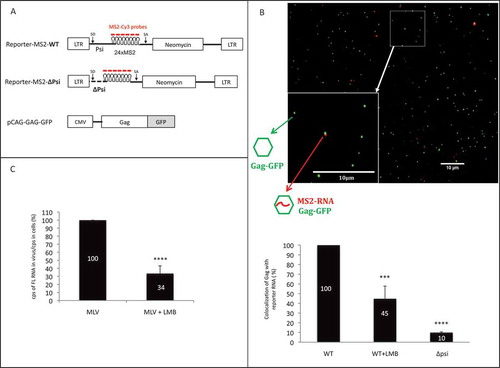
Figure 4. Influence of CRM1 and/or NXF1 inhibition on FL RNA packaging. (A) Schematic maps of the MLV clones expressed into the NIH3T3 cells. The insertion of GFP in gag gene, is represented in grey and enables the production of Gag in cis in native level. The NV-MS2 construct producing a non-viral RNA was used as negative control as described in [Citation25]. The visualization of MS2-tagged RNA was based on the interaction with the MS2 coat protein fused to mCherry (dark grey) and co-transfected with the MLV plasmids. (B) The graph represents the packaging ability of MLV in each condition. The number of grey dots colocalized with dark grey dots was determined and packaging efficiencies were calculated as the ratios of Gag with RNA: total Gag. n ≥ 700 virions. Percentages are presented as mean ± SEM.
![Figure 4. Influence of CRM1 and/or NXF1 inhibition on FL RNA packaging. (A) Schematic maps of the MLV clones expressed into the NIH3T3 cells. The insertion of GFP in gag gene, is represented in grey and enables the production of Gag in cis in native level. The NV-MS2 construct producing a non-viral RNA was used as negative control as described in [Citation25]. The visualization of MS2-tagged RNA was based on the interaction with the MS2 coat protein fused to mCherry (dark grey) and co-transfected with the MLV plasmids. (B) The graph represents the packaging ability of MLV in each condition. The number of grey dots colocalized with dark grey dots was determined and packaging efficiencies were calculated as the ratios of Gag with RNA: total Gag. n ≥ 700 virions. Percentages are presented as mean ± SEM.](/cms/asset/bfae44f1-6e56-47f6-bfc6-2af354375ed1/krnb_a_1713539_f0004_b.gif)
Figure 5. Current model of the MLV nuclear export and its impact on the outcome of the FL RNA in the cytoplasm. The model proposed is based on our present results and published data (arrow in full line) as well as hypothesis (dotted arrow). Briefly, the FL RNA is firstly driven to the NXF1 pathway probably because of its methylation. Because of cis element structures present in pol gene [Citation14,Citation16], NXF1 interacts with FL RNA and drives it through the nuclear pore until to reach the MTOC [Citation44]. Then, FL RNA is directed until polysome [Citation14] and is translated in Gag proteins. If a few amount of Gag proteins could reach the nucleus [Citation39], it could serve as viral partner for CRM1 interaction to export FL RNA. Then, FL RNA complexed to Gag targets the packaging sites at the plasma membrane to form neo particles.
![Figure 5. Current model of the MLV nuclear export and its impact on the outcome of the FL RNA in the cytoplasm. The model proposed is based on our present results and published data (arrow in full line) as well as hypothesis (dotted arrow). Briefly, the FL RNA is firstly driven to the NXF1 pathway probably because of its methylation. Because of cis element structures present in pol gene [Citation14,Citation16], NXF1 interacts with FL RNA and drives it through the nuclear pore until to reach the MTOC [Citation44]. Then, FL RNA is directed until polysome [Citation14] and is translated in Gag proteins. If a few amount of Gag proteins could reach the nucleus [Citation39], it could serve as viral partner for CRM1 interaction to export FL RNA. Then, FL RNA complexed to Gag targets the packaging sites at the plasma membrane to form neo particles.](/cms/asset/f1fb1160-31e6-409e-9bfd-6114fdcae53d/krnb_a_1713539_f0005_oc.jpg)