Figures & data
Table 1. Spectral counting-based identification of proteins co-immunoprecipitating with EV-A71 3D protein.
Table 2. Enrichment analysis of biological processes for proteins interacted with the EV-A71 3D protein.
Figure 1. Identification of cellular proteins that interact with EV-A71 3D. HEK293T cells were transfected with control vectors and plasmids that express the 3× FLAG-tagged EV-A71 3D, respectively. At 48 h posttransfection, the lysates of transfected cells were examined by immunoblotting with anti-FLAG and anti-β-actin antibodies (A). The lysates were then subjected to immunoprecipitation with anti-FLAG resin, and the precipitated proteins were separated by SDS-PAGE following by a Colloidal Blue stain or an immunoblot with anti-EV-A71 3D antibody (B). The precipitated proteins were identified with LC-MS/MS. (C) Venn diagrams show overlaps between the proteins identified in the control and the 3D groups. (D) Venn diagrams display overlaps between the proteins identified in the four replicates. The total numbers of identified proteins are listed in brackets.
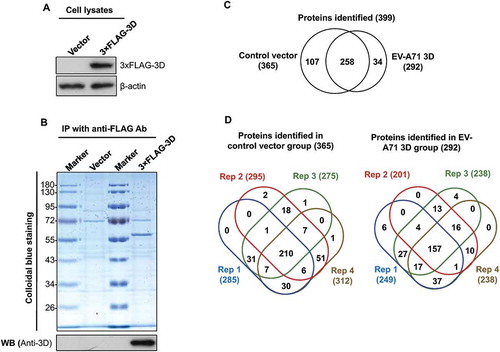
Table 3. Pathway analysis of the proteins interacted with the EV-A71 3D protein.
Figure 2. Protein–protein interaction (PPI) network of the proteins identified in co-immunoprecipitate of EV-A71 3D. A PPI network of the 50 proteins listed in was constructed using the STRING v10 database (http://string-db.org/), depicting 90 interaction links between individual nodes/proteins (solid lines). One module was identified in STRING analysis that depicted the interactions of RPS6 with proteins involved in biological processes of protein translation, translational initiation, and SRP-dependent cotranslational protein targeting to membrane.
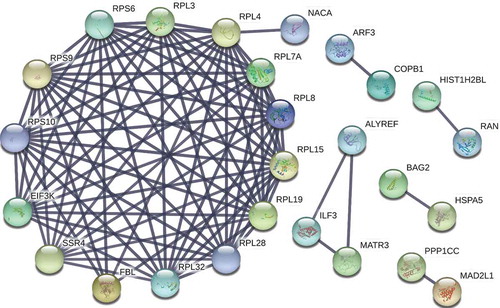
Figure 3. Validation of the interaction between the EV-A71 3D and ribosomal protein RPS6. (A) HEK293T cells were transfected with plasmids expressing the 3× FLAG-tagged EV-A71 3D from either C2 or C4 subgenotype. At 24 h posttransfection, the cell extracts were collected for anti-FLAG immunoprecipitation without (upper panel) or with RNase pretreatment (middle panel, 1 μg/μL at 27°C for 10 min). (B) Recombinant EV-A71 3D proteins were incubated with GST or GST-tagged RPS6 recombinant proteins and then selected by glutathione-Sepharose resin. Pull-down samples were subjected to immunoblotting using anti-EV-A71 3D and anti-GST antibodies. Input: 10% of the mixture composed of recombinant 3D and RPS6 proteins. (C) RD cells were infected with EV-A71 strain of 4643 at MOI 40 for 8 h. The cell extracts were subjected to immunoprecipitation with anti-3D antibody. (D) RD cells were transfected with the 3× FLAG-tagged RPS6-expressing plasmid for 20 h, and then infected with EV-A71 strain of 4643 at MOI 40 for 8 h. The cell extracts were then subjected to anti-FLAG immunoprecipitation. The extracts and immunoprecipitates were analysed by immunoblotting with anti-FLAG, anti-EV-A71 3D, anti-RPS6, and anti-β-actin antibodies.
Figure 4. EV-A71 3D protein partially colocalizes with RPS6 during infection and knockdown of RPS6 inhibits viral replication. (A) HeLa cells were infected with EV-A71 at MOI of 80 for 6 h. The cells were fixed and reacted with rabbit anti-RPS6 and mouse anti-EV-A71 3D antibodies. After washing, the cells were incubated with the species-specific secondary antibodies conjugated with fluorescence dyes, stained with Hoechst 33,258, and then examined under confocal microscopy. (B) RD cells were transfected with either control siRNA (Ctrl) or siRNA against RPS6. Knockdown efficiency was evaluated by immunoblotting with anti-RPS6 antibody. β-actin served as the loading control. (C) siRNA-transfected RD cells were infected with EV-A71 at MOI of 0.001. Infected cells were harvested at 24 hpi and the viral yield was estimated by plaque formation assay. The experiment was triplicated. The result represents one of the experiments. The error bars represented the standard deviation (SD). Statistical analysis was performed by the Student’s t test. **: p < 0.01. Bar, 10 µm. hpi, hour postinfection. PFU: plaque-forming unit.
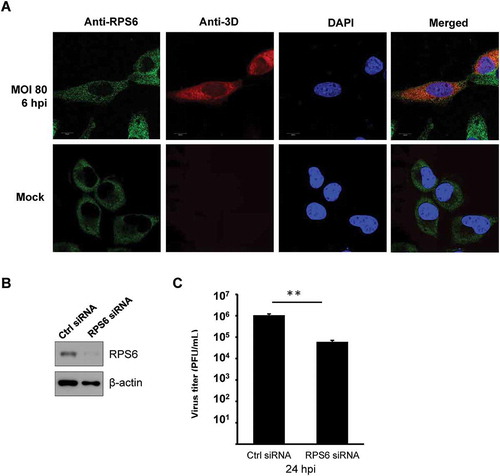
Figure 5. The overexpressed EV-A71 3D cosediments with ribosome complexes. (A) Polysome profiling of HEK293T cells transfected with empty vector, or expression vector encoding the EV-A71 3D of either C2 (marked in red) or C4 (blue) subgenotype was analysed by 10–50% sucrose gradient. Peaks representative of 40S, 60S subunits, 80S monosomes and polysomes were indicated (upper panel). 18S and 28S rRNA of the 15 fractions corresponding to each ribosomal assembly were shown below. (B) Distribution of EV-A71 3D proteins in the factions described in (A) was analysed by immunoblotting using anti-FLAG antibody. Ribosomal protein RPS6 and RPL0 that served as the marker of small and large ribosomal subunit were also detected.
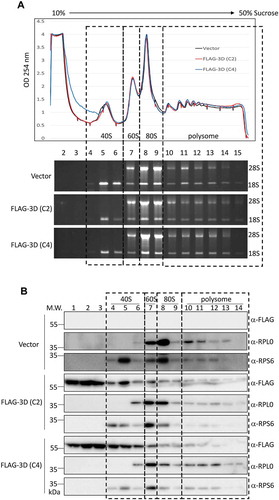
Figure 6. The EV-A71 3D/3CD in infected cell associates with ribosome complex despite polysome disruption. (A) Polysome profiling of RD cells infected with EV-A71 MP4 strain at MOI of 10 was analysed as described in Fig. 6. MP4 infection (marked in red) disrupted the polysome peaks while the 80S monosome peak increased when compared with the profile of mock-infected cell (black). (B) Cleavage of eIF4G upon EV-A71 infection was examined by immunoblotting using anti-eIF4G antibody. Expression of EV-A71 3D and 3CD proteins was analysed by using anti-EV-A71 3D antibody. Proteins level of RPS6, RPL0, and β-actin served as the loading control. (C) Immunoblotting was performed to analyse the distributions of EV-A71 3D/3CD and 3A/3AB in the sucrose gradient using antibody against EV-A71 3D and 3A, respectively. Fractions representative of different ribosomal assemblies were verified by antibodies against RPS6 and RPL0. In. represented 5% lysates layered onto the gradient in the beginning.
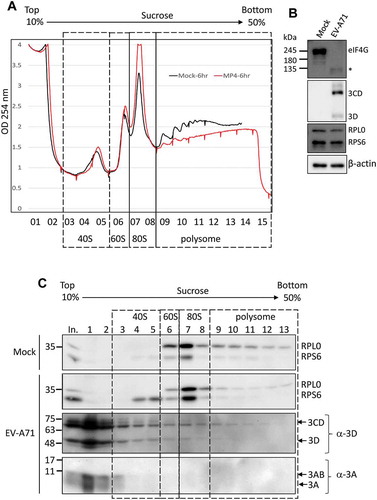
Figure 7. The overexpressed EV-A71 3D elevates IRES-driven translation in vivo. (A) Scheme shows the bicistronic RNA produced from pRHF-EV-A71 reporter plasmid. Translation of firefly and Renilla luciferase are dependent on 5ʹ end cap and EV-A71 IRES, respectively. (B) Reporter plasmid was co-transfected with effector plasmid encoding EV-A71 3D proteins into HEK293T cells. The overexpressed 3D of EV-A71 C2 (lane2) and C4 (lane3) strain enhanced the EV-A71 IRES activity. Expression level of 3D proteins was examined by immunoblotting using anti-FLAG antibody. β-actin served as the loading control. (C) Similar to the experiment described in (B) but control siRNA (Ctrl) or siRPS6 was included. Knockdown of RPS6 was confirmed by immunoblotting with anti-RPS6 antibody. The error bars represented the standard deviation (SD). Statistical analysis was performed by the Student’s t test. ***: p <0.001; **: p <0.01. ns: not significant.
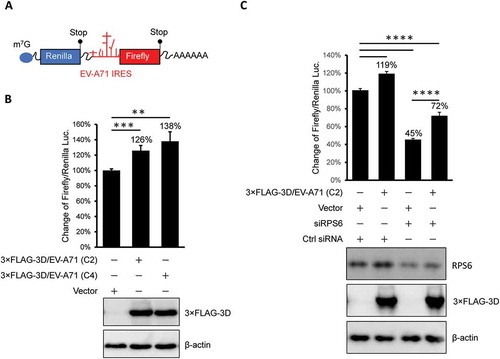
Figure 8. The 3D protein directly activates both cap- and IRES-dependent translation in vitro. In vitro translation was performed in 60% S10 extracts prepared from HEK293T cells in the presence of the recombinant EV-A71 3D proteins (lane 3–5) or not (lane 1–2) to analyse (A) cap- and (B) IRES-dependent translation. Ctrl: control group, +Cap: lysates pretreated with 1mM m7G cap analogue. The recombinant EV-A71 3D proteins in each reaction were examined by immunoblotting using anti-EV-A71 3D antibody. Ribosomal proteins RPS6 and RPL0 served as the loading controls. Statistical analysis was performed by the two-way ANOVA. ***: p <0.001; ns: not significant.