
Figures & data
Figure 1. A. thaliana l- or s-tRFs can inhibit translation in vitro. (A) Kinetics of cleavage of Arabidopsis in vitro synthesized tRNAAla(UGC) transcript upon incubation in the presence (+) or absence (-) of a crude enzymatic extract from Arabidopsis leaves (Enz. Ex.). After incubation, RNAs were phenol extracted and fractionated on 15% polyacrylamide gel, followed by northern blot analysis with a radiolabeled oligonucleotide specific for the 5ʹ extremity of cytosolic Arabidopsis tRNAAla. (B) Cleavage of Arabidopsis total tRNA (Tot RNA) upon incubation in the presence (+) or absence (-) of a crude enzymatic extract from Arabidopsis leaves (Enz. Ex.). After incubation, RNAs were phenol extracted and fractionated on a 15% polyacrylamide gel, followed by northern blot analysis with a radiolabeled oligonucleotide specific for the 5ʹ extremity of cytosolic Arabidopsis tRNAAla. (C) Production of long (l-tRF) and short (s-tRF) tRFs by in vitro cleavage of total Arabidopsis tRNAs in the presence (+) of a crude enzymatic extract from Arabidopsis leaves (Enz. Ex.). After incubation, RNAs were phenol extracted, fractionated on 15% polyacrylamide gel and all l-tRFs and s-tRFs were purified separately from the gel. (D) Effect of the addition of total Arabidopsis tRNAs or tRFs purified in (B) on the synthesis of GFP in a wheat germ coupled transcription/translation system in the presence of 35S methionine. Radiolabeled GFP was detected by autoradiography or phosphor imaging after fractionation on 15% acrylamide gel. Two concentrations of tRNAs or tRFs were used: 4 µM (tRNA-4 and tRF-4) and 8 µM (tRNA-8 and tRF-8). Mock = control experiment without added tRNAs or tRFs. Coomassie blue staining of the gel is shown as a loading control. (E) Relative quantification of in vitro synthesized pGFP in experiments similar to that described in (D). Error bars show standard deviations (mean of three biological replicates). One-way ANOVA tests were used to calculate p-values. Asterisks indicate statistically significant differences between Mock and each treatment (***P< 0.001; **P< 0.01; *P< 0.1). A value of 1 has been given to the Mock sample.
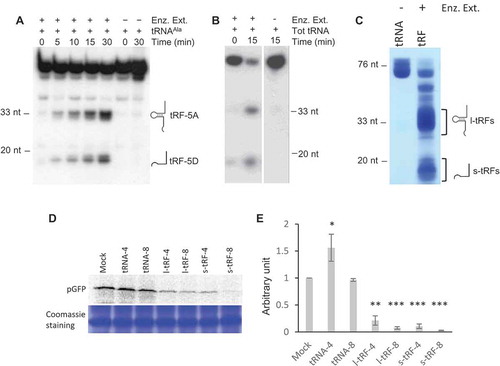
Figure 2. A subset of Arabidopsis tRFs can inhibit efficiently translation in vitro. (A) Features of the 10 tRFs analysed in this work. Their sequences are presented in Supplemental Table 1 and the data derive from [Citation28]. Besides, tRF-5A (Asp) was also found in AGO1 immunoprecipitates (L. Drouard, personal communication). (B) The synthetic tRFs presented in (A) were tested for their ability to inhibit the in vitro protein synthesis of pGFP. Experiments were performed essentially as described in . Two concentrations of oligoribonucleotides (0.2 and 1 µM) were used. Quantifications of the results are presented in (C). An arbitrary value of 1 (dotted vertical line) has been given to in vitro synthesized pGFP in the absence of added tRF (Mock experiment: M). Error bars represent standard errors of the mean of independent biological experiments (n = 3 to 13). One-way ANOVA tests were used to calculate p-values. Asterisks indicate statistically significant differences between Mock and each treatment (**P< 0.01; *P< 0.1). Dark grey: 0.2 µM, pale grey: 1 µM.
![Figure 2. A subset of Arabidopsis tRFs can inhibit efficiently translation in vitro. (A) Features of the 10 tRFs analysed in this work. Their sequences are presented in Supplemental Table 1 and the data derive from [Citation28]. Besides, tRF-5A (Asp) was also found in AGO1 immunoprecipitates (L. Drouard, personal communication). (B) The synthetic tRFs presented in (A) were tested for their ability to inhibit the in vitro protein synthesis of pGFP. Experiments were performed essentially as described in Fig. 1C. Two concentrations of oligoribonucleotides (0.2 and 1 µM) were used. Quantifications of the results are presented in (C). An arbitrary value of 1 (dotted vertical line) has been given to in vitro synthesized pGFP in the absence of added tRF (Mock experiment: M). Error bars represent standard errors of the mean of independent biological experiments (n = 3 to 13). One-way ANOVA tests were used to calculate p-values. Asterisks indicate statistically significant differences between Mock and each treatment (**P< 0.01; *P< 0.1). Dark grey: 0.2 µM, pale grey: 1 µM.](/cms/asset/61c412ab-ccd1-4af5-832e-76a1ab482a20/krnb_a_1722514_f0002_oc.jpg)
Figure 3. The tRF-5D (Ala) of 20 nt efficiently inhibits translation in vitro. (A) Sequences of the three tRF-5D of 16, 20, and 33 nt (Ala16, Ala20, and Ala33) deriving from Arabidopsis tRNAAla(AGC). (B) Effect of the addition of Ala16, Ala20, and Ala33 on the in vitro synthesis of pGFP protein. The experiment was performed as described in . Increasing concentrations of synthetic tRFs were used: 0.2, 0.4, 1, 2 and 4 µM. M = Mock, control experiment without tRF. Coomassie blue staining of the gel is shown as a loading control. (C) Relative quantification of in vitro synthesized GFP in the experiment presented in (B). Ala16: white triangles, Ala20: black squares, Ala33: Grey circles. (D) Relative quantification of in vitro synthesized pGFP in experiments similar to that described in (A) and for a tRF concentration of 1 µM. Error bars show standard deviations (mean of three biological replicates). A value of 1 has been given to M. (E) In vitro protein synthesis in a wheat germ translation system of synthesized pGFP transcript in the presence of 35S methionine. Capped or uncapped transcript was used in the absence or presence of Ala20 or Asn20 oligoribonucleotide at 1 µM concentration. M = Mock, control experiment without tRF. Coomassie blue staining of the gel is shown as a loading control. (F) Effect of the addition of Ala16 and Ala20 oligoribonucleotides on the in vitro synthesis of DHFR protein. The experiment was performed as described in with the same concentration range.
Figure 4. Importance of A16, G18, and G19 of tRF-5D (Ala) for the inhibition of translation. (A) Sequence alignment of Ala20, Ala16, Asn20 with the mutated versions Ala20-5U, Ala20-3U, and Asn20-3U. Us replacing Gs are in bold and underlined (B) Effect of the addition of the Ala20-5U and Ala20-3U presented in (A) on the in vitro synthesis of pGFP. The experiment was performed as described in with the same concentration range. (C) Quantification of in vitro synthesized pGFP in experiments similar to that described in (B). Error bars represent standard errors of the mean of independent biological experiments (n = 3 to 13). One-way ANOVA tests were used to calculate p-values. Asterisks indicate statistically significant differences between Mock and each treatment (****P< 0.0001). A value of 1 has been given to M (Mock, control experiment without tRF). (D) Effect of the addition of Ala20-3U or Asn20-3U on the in vitro synthesis of pGFP. Experiment was performed as in (B). Two concentrations of oligoribonucleotides (0.2 and 1 µM) were used. (E) Sequence alignment of Ala20 and Arg19 with the mutated versions Ala20-A16, Ala20A16U, Arg19+ A16, Arg19+ U16. Mutated or added nucleotides are in bold and underlined. The A residue at position 16 in Asn20 and Ala20 is under grey background. In vitro synthesis of pGFP in the presence of these oligoribonucleotides and quantifications of the results are presented in (F) and (G) respectively. The experiments were performed as in , except that only two concentrations of oligoribonucleotides (0.2 and 1 µM) were used. Error bars represent standard errors of the mean of independent biological experiments (n = 3 to 13). A value of 1 has been given to M (Mock, control experiment without tRF). One-way ANOVA tests were used to calculate p-values. Asterisks indicate statistically significant differences between Mock and each treatment (****P< 0.0001; **P< 0.01).
Figure 5. tRF-5D (Ala) associates with polyribosomes in vitro and in vivo. (A) Polyribosomes profile of Arabidopsis seedlings pre-incubated in vitro with Ala20 was determined using sucrose gradient sedimentation and OD254nm measurement (blue line) and conductivity (red line). Samples were treated or not with Puromycin. The positions of the heavy and light polyribosomes, 80S and ribosomal subunits and free RNAs are shown on the graphs. (B) RNAs extracted from each fraction shown in (A) were fractionated on 15% polyacrylamide gels and analysed by northern blots using probes specific for 5S rRNA, tRNAAla and tRF-5D (Ala). Ethidium bromide (EtBr) profiles are also shown. (C) Profiles obtained after quantification of the signals from the northern blots (5S rRNA in blue, tRNA in grey and tRF Ala20 in orange) performed with samples not treated with puromycin. Due to saturation of the free RNA fractions with the alanine probe, quantification was done only for fractions 1 to 11. An arbitrary value of 10 was given to the highest value obtained for each curve. Note that the intensity of the signals is not comparable from one curve to the other. In (D) a similar experiment was performed without adding any tRF to determine in vivo association of tRF-5D (Ala) with polyribosomes. The RNA fragments corresponding to the signals a and b are indicated by arrows. In (E) the profiles obtained after northern blots quantification with 5S rRNA probes (in blue) are compared to those obtained for a or b (in orange).
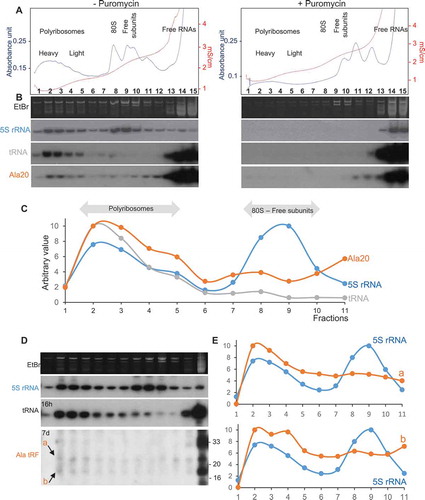
Figure 6. Representative examples of modulation of translation by tRFs. (A) Inhibition of translation by human l-tRF (Ala), via a G-quadruplex structure (Gq), by displacement of eIF4G/A and interaction with YB-1. (B) In human cells and this work in Arabidopsis shows that s-tRFs can associate with active polyribosomes. The two residues G18 and G19 (GG) are essential. Also, an interaction between the MultiSynthetases Complex (MSC) and tRFs have been characterized in humans. Note that in human cells, while global repression of translation has been observed [Citation19], the protein synthesis of a specific set of mRNAs (coding for ribosomal and RNA-binding proteins) is, by contrast, stimulated [Citation19]. (C) In the archaea H. volcanii, s-tRFs bind to the small ribosomal subunit and compete with mRNA for ribosome binding. (D) In the yeast S. cerevisiae, l-tRFs directly interact with the small ribosomal subunit and with aminoacyl-tRNA synthetases associated with ribosomes, thus impairing tRNA aminoacylation. (E) The tRNAThr 3ʹ half (depicted in green) stimulates protein synthesis in the protozoan T. brucei, by interacting with ribosomes.
![Figure 6. Representative examples of modulation of translation by tRFs. (A) Inhibition of translation by human l-tRF (Ala), via a G-quadruplex structure (Gq), by displacement of eIF4G/A and interaction with YB-1. (B) In human cells and this work in Arabidopsis shows that s-tRFs can associate with active polyribosomes. The two residues G18 and G19 (GG) are essential. Also, an interaction between the MultiSynthetases Complex (MSC) and tRFs have been characterized in humans. Note that in human cells, while global repression of translation has been observed [Citation19], the protein synthesis of a specific set of mRNAs (coding for ribosomal and RNA-binding proteins) is, by contrast, stimulated [Citation19]. (C) In the archaea H. volcanii, s-tRFs bind to the small ribosomal subunit and compete with mRNA for ribosome binding. (D) In the yeast S. cerevisiae, l-tRFs directly interact with the small ribosomal subunit and with aminoacyl-tRNA synthetases associated with ribosomes, thus impairing tRNA aminoacylation. (E) The tRNAThr 3ʹ half (depicted in green) stimulates protein synthesis in the protozoan T. brucei, by interacting with ribosomes.](/cms/asset/56896be6-63f4-486a-8209-4125961459e6/krnb_a_1722514_f0006_oc.jpg)