Figures & data
Figure 1. Small Angle X-ray Scattering analysis of HsLa, HsLaRP7, HsLaRP6 and HsLaRP4A and HsLaRP4B La-modules. The domain boundaries of the La-motif (LaM) and RNA Recognition Motif 1 (RRM1), delineating the exact beginning and end of the structured domains, are indicated on top for each protein. In the case HsLaRP4B, for which structural analysis is underway (Conte et al., unpublished), this is an initial estimate from sequence alignment with LaRP4A proteins. (A-E) SEC elution profiles for the five La-modules in the apo state as labelled (black traces). The SEC elution profiles for HsLa, HsLaRP7 and HsLaRP6 in complex with U4 for HsLa and HsLaRP7 and with 48ntSL RNA for HsLaRP6 are shown as red traces in A, B and C. (F-J) Scattering curves obtained after buffer normalization and averaging (black traces for the apo La-modules, red traces for the complexes with RNA). (K-O) Normalized Kratky representations (in black for the apo La-modules and in red for the complexes with RNAs) calculated from data in the range q = 0.02–0.3. The typical values expected for globular proteins [I(q)/I(0)]⋅(q⋅Rg)2 = 1.104, q⋅Rg = 1.73] are indicated by grey dashed cross lines
![Figure 1. Small Angle X-ray Scattering analysis of HsLa, HsLaRP7, HsLaRP6 and HsLaRP4A and HsLaRP4B La-modules. The domain boundaries of the La-motif (LaM) and RNA Recognition Motif 1 (RRM1), delineating the exact beginning and end of the structured domains, are indicated on top for each protein. In the case HsLaRP4B, for which structural analysis is underway (Conte et al., unpublished), this is an initial estimate from sequence alignment with LaRP4A proteins. (A-E) SEC elution profiles for the five La-modules in the apo state as labelled (black traces). The SEC elution profiles for HsLa, HsLaRP7 and HsLaRP6 in complex with U4 for HsLa and HsLaRP7 and with 48ntSL RNA for HsLaRP6 are shown as red traces in A, B and C. (F-J) Scattering curves obtained after buffer normalization and averaging (black traces for the apo La-modules, red traces for the complexes with RNA). (K-O) Normalized Kratky representations (in black for the apo La-modules and in red for the complexes with RNAs) calculated from data in the range q = 0.02–0.3. The typical values expected for globular proteins [I(q)/I(0)]⋅(q⋅Rg)2 = 1.104, q⋅Rg = 1.73] are indicated by grey dashed cross lines](/cms/asset/9b997d09-4498-425b-afe4-5b46244b64f7/krnb_a_1733799_f0001_oc.jpg)
Table 1. SAXS-derived parameters and experimental details
Figure 2. Distance distribution functions and ab-initio models. (A-E) Distance distribution functions for the La-modules of La, HsLaRP7, HsLaRP6, HsLaRP4A and HsLaRP4B in the apo form (black traces) and for the La-modules of HsLa, HsLaRP7 and HsLaRP6 in complex with their target RNAs in red traces. The distance distribution function for free 48ntSL RNA is shown in orange in C. (F-N) Low-resolution ab-initio models were generated from the distance distribution functions for the La-modules (F-J, grey), for HsLa and HsLaRP7 and HsLaRP6 in complex with RNA (K-M, red) and for the 48ntSL RNA (N, orange). A similar orientation for each model was chosen (approximately as in , left) based on superposition on the HsLa structure following SUPCOMB fitting of the ab-initio models to the respective atomic structures, when available, or to the HsLa structure for HsLaRP6 and HsLaRP4B
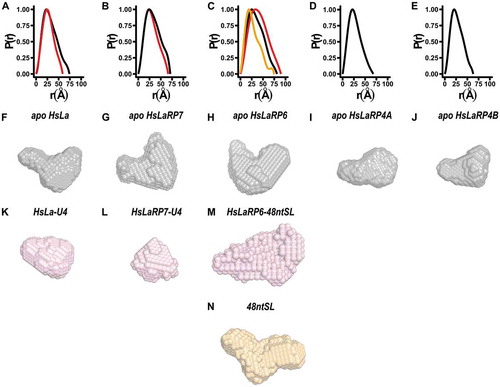
Table 2. CRYSOL and EOM analysis of the SAXS data for the La-modules using available high-resolution structural information
Figure 3. Ensemble Optimization Method (EOM) for the HsLa, HsLaRP7, HsLaRP6, and HsLaRP4A La-modules. (A-D) Distribution of the Rg (red) of the 10.000 conformations generated by allowing flexibility to the linker residues (see methods) and Rg for the ensemble of models that best fit the scattering data (black). The most populated state is marked with an asterisk (*) and the population percentages are shown. (E-H) Distribution of the Dmax of all possible conformations (red) and those of the ensemble that best fit the scattering data (black). The most populated state is marked with an asterisk (*) and the population percentages are shown. (I-L) Fitting of the representative structures of the ensemble to the experimentally recorded scattering curves. (M-P) Representative structures of the ensemble of conformation in the context of the ab-initio models generated by DAMMIF, where the LaM domain (orange) is shown in a fixed orientation, to highlight the different positioning of the RRM1 domain (in pink, blue and green). The colour code used is: pink, blue, green from the most to least populated conformation. The most populated conformation of the RRM1 (pink) is marked with an asterisk (*). The linker regions, input as flexible residues in the EOM process, are represented as dashed lines
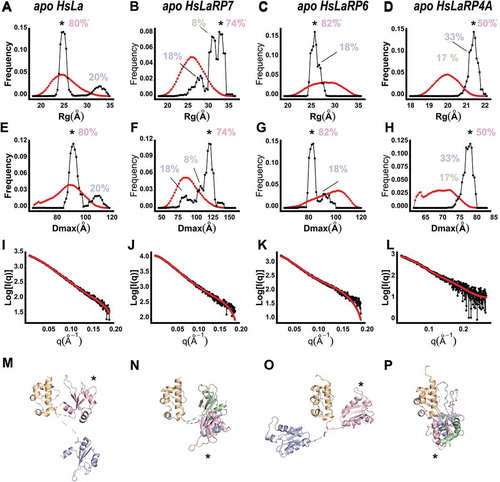
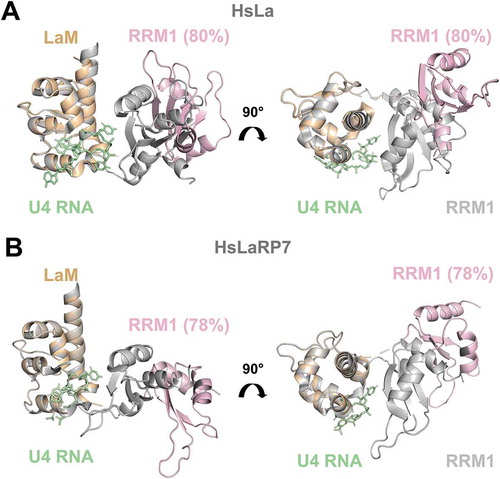
Figure 4. Comparison of crystal structures of RNA-bound forms with EOM-derived models of apo La-modules. (A) Superposition of the X-ray structure of HsLa-U4 (PDB 2VOP, protein in grey and RNA in green) with the most abundant apo HsLa EOM ensemble structure (LaM in orange and RRM1 in light pink, same colour-code used in ). (B) Superposition of the X-ray structure of HsLaRP7-U4 (PDB 4WKR, protein in grey and RNA in green) with the preferred apo HsLaRP7 EOM ensemble structure (LaM in orange and RRM1 in light pink). The percentages indicate the fraction of the molecular population that exists in a particular state. The structures in (A) and (B) are aligned on the LaM. Although their RNA-bound forms are highly similar, the apo EOM models of HsLa and HsLaRP7 differ. For HsLa a more similar domain arrangement in the RNA-bound crystal structure and in the EOM model of the apo La-module could be observed (see also Supplementary Fig. S8)