
Figures & data
Figure 1. A miR-206 knockout (KO) cell line shows a delay in myotube formation upon differentiation. (A) miR-206 expression does not increase in miR-206 KO cells incubated in differentiation media. Average fold change in miR-206 expression, normalized to control sno202 RNA levels, on Day 4 relative to Day 0 is plotted. The error bars denote the standard deviations (n = 3). ** indicates a p-value < 0.01, as determined from an unpaired two-tailed t-test. (B) miR-206 KO cells show a delay in myotube formation upon treatment with differentiation media compared to WT cells. Representative images of Jenner-Giemsa stained C2C12 WT and miR-206 KO cells during a time course of treatment with differentiation media are shown. Cells were switched to differentiation media on Day 0. (C) miR-206 KO cells show significantly less myotube density upon treatment with differentiation media compared to WT cells. Cells were switched to differentiation media on Day 0. Myotube density was calculated as the sum of pixels attributed to tones 0–75 at each time point [Citation29]. The data are the average of twelve imaged regions from three biological replicates, and the error bars denote the standard deviations (n = 12). ** indicates a p-value < 0.01 and *** indicates a p-value < 0.001, as determined from an unpaired two-tailed t-test. (D) Myosin and myogenin proteins are expressed at similar levels in WT and miR-206 KO cells. Shown are Western blots before and after treatment with differentiation media. (E) miR-1 expression is induced to similar levels in WT and miR-206 KO cells after culturing in differentiation media. Average fold change in miR-1 expression, normalized to control sno202 RNA levels, on Day 4 relative to Day 0 is plotted; the error bars denote the standard deviation (n = 3).
![Figure 1. A miR-206 knockout (KO) cell line shows a delay in myotube formation upon differentiation. (A) miR-206 expression does not increase in miR-206 KO cells incubated in differentiation media. Average fold change in miR-206 expression, normalized to control sno202 RNA levels, on Day 4 relative to Day 0 is plotted. The error bars denote the standard deviations (n = 3). ** indicates a p-value < 0.01, as determined from an unpaired two-tailed t-test. (B) miR-206 KO cells show a delay in myotube formation upon treatment with differentiation media compared to WT cells. Representative images of Jenner-Giemsa stained C2C12 WT and miR-206 KO cells during a time course of treatment with differentiation media are shown. Cells were switched to differentiation media on Day 0. (C) miR-206 KO cells show significantly less myotube density upon treatment with differentiation media compared to WT cells. Cells were switched to differentiation media on Day 0. Myotube density was calculated as the sum of pixels attributed to tones 0–75 at each time point [Citation29]. The data are the average of twelve imaged regions from three biological replicates, and the error bars denote the standard deviations (n = 12). ** indicates a p-value < 0.01 and *** indicates a p-value < 0.001, as determined from an unpaired two-tailed t-test. (D) Myosin and myogenin proteins are expressed at similar levels in WT and miR-206 KO cells. Shown are Western blots before and after treatment with differentiation media. (E) miR-1 expression is induced to similar levels in WT and miR-206 KO cells after culturing in differentiation media. Average fold change in miR-1 expression, normalized to control sno202 RNA levels, on Day 4 relative to Day 0 is plotted; the error bars denote the standard deviation (n = 3).](/cms/asset/b05f1b98-21ec-4150-b0b3-c9b2154a5065/krnb_a_1737443_f0001_c.jpg)
Figure 2. Downregulation of known miR-206 targets is attenuated in miR-206 KO cells compared to WT. (A) Endogenous mRNA levels of Ccnd1 and Gja1 are downregulated in WT cells and miR-206 KO cells after four days in differentiation media. Average fold change in mRNA expression, normalized to Csnk2a2, on Day 4 relative to Day 0 is plotted. The error bars denote standard deviations (n = 3). The dashed line at 1.0 represents no change in mRNA levels. ## indicates a p-value < 0.01 and ### indicates p-value < 0.001 as compared to 1.0 (no change), determined from a one sample two-tailed t-test. (B) The 3ʹUTRs of Ccnd1 and Gja1 downregulate luciferase expression in WT cells but not in miR-206 KO cells upon four days of treatment with differentiation media. Normalized average fold change in luciferase expression after treatment with differentiation media is plotted. The error bars denote standard deviations (n = 3). The dashed line at 1.0 represents no change in luciferase expression. # indicates a p-value < 0.05, ## indicates a p-value < 0.01, and ### indicates a p-value < 0.001 as compared to 1.0 using a one sample two-tailed t-test. * indicates a p-value < 0.05, as determined from an unpaired two-tailed t-test comparing the data from the WT and KO cells.
Figure 3. Representative xOP-seq data for Adam19, Bgn, Spg20, and Tmcc3. Mapped reads from sequencing replicate 1 show enrichment in the 3ʹUTRs in the Day 4 compared to Day 0 data. The locations of miR-206 seed sequences are marked. Sequencing tracks were generated from the UCSC Genome Browser display of bedgraph files.
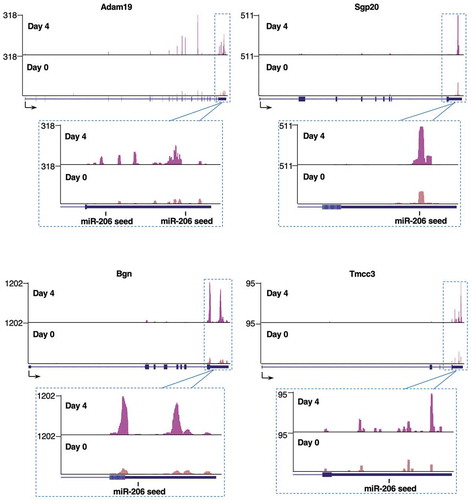
Figure 4. Putative mRNA targets of miR-206 identified by xOP-seq are differentially regulated in miR-206 KO cells compared to WT cells. (A) Endogenous levels of Bgn, Cbx5, Smarce1, and Spg20 mRNAs decrease in WT cells upon differentiation and show different levels of regulation in miR-206 KO cells after four days in differentiation media. Normalized average fold change in mRNA expression on Day 4 relative to Day 0 is plotted. The error bars denote standard deviations (n = 3). The dashed line at 1.0 represents no change in mRNA levels. # indicates a p-value < 0.05 and ## indicates a p-value <0.01 as compared to 1.0 using a one sample two-tailed t-test, except for Spg20 in WT, which has a p-value < 0.068. (B) Regions from the 3ʹUTRs of five putative miR-206 target mRNAs (Adam19-1, Bgn, Cbx5-2, Smarce1 and Spg20) downregulate luciferase expression in WT cells but not miR-206 KO cells after treatment with differentiation media. Normalized average fold change in luciferase expression after differentiation is plotted; the error bars denote standard deviations (n = 3). The dashed line at 1.0 represents no change in luciferase expression. # indicates a p-value < 0.05 as compared to 1.0 using a one sample two-tailed t-test, except for Cbx5-2 in WT, which has a p-value < 0.062. * indicates a p-value < 0.05, as determined from an unpaired two-tailed t-test comparing the data from the WT and KO cells.
Supplemental Material
Download PDF (453.3 KB)Data availability statement
Sequencing data were deposited in the NCBI Gene Expression Omnibus (https://www.ncbi.nlm.nih.gov/geo/) and are accessible through GEO Series GSE143029.