Figures & data
Table 1. Overexpression of miRNAs induces the increase of deregulated transcripts over time. The cut-off value of was applied to identify significantly deregulated mRNAs. Fold change in transcript numbers shows the difference between two sequential time points.
Figure 1. Downregulation of transcripts over multiple time points upon miRNA overexpression. Total number of the downregulated transcripts after the overexpression of miR-17 (a), miR-517a (b) and miR-315b (c) was considered as 100% and their occurrence at the individual time points is shown as the respective percentages. Dark blue colour indicates the transcripts whose expression is reduced at 12 h, 24 h and 36/48 h, light blue colour – at 24 h and 36/48 h, orange colour – at 12 h and 24 h and yellow colour – at 12 h and 36/48 h. The fractions of downregulated transcripts at single time points are indicated below the respective time point.
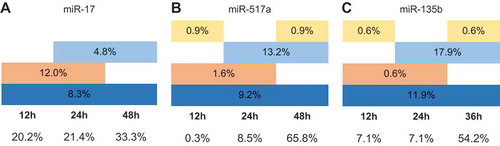
Table 2. Changes in localization and appearance of multiple seed sequence positions over time. Position-wise distribution is reported as a fraction of all the experimentally determined downregulated genes. Three main combinations of seed sequence localization (3ʹ-UTR only, 3ʹ-UTR and CDS, CDS only) are provided explicitly, while the ‘others’ graph contains the cases that are rarer: 5ʹ-UTR-only, 5ʹ-UTR and CDS, 3ʹ-UTR and 5ʹ-UTR and 3ʹ-UTR, CDS and 5ʹ-UTR.
Table 3. Target recognition by ‘classical’ (a) and machine learning-based (b) detection algorithms on the downregulated transcripts in time-resolved microarray experiments and on the validated miR-17 targets (c).
Figure 2. Time-dependent occurrence of the seed sequences following the overexpression of miR-17-5p (a), miR-517a-3p (b) and miR-135b-5p (c). Seed sequence presence and localization within the transcript were determined as described in Materials and Methods. Data are provided as a percentage of all the experimentally determined downregulated genes, transcripts of which possess respective seed sequence complements for miR-17-5p (‘GCACUUU’), miR-517a-3p (‘UGCACGA’) and miR-135b-5p (‘AAGCCAU’).
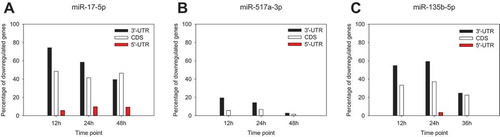
Figure 3. Bioinformatics target detection by different algorithms with respect to the presence of seed sequences. Downregulated transcripts at 12 h post-transfection of miR-17-5p (a), miR-517a-3p (b) and miR-135b-5p (c) were analysed. Black colour represents a fraction of targets possessing at least a single seed sequence and detected as true positives by a respective algorithm, white colour corresponds to not recognized mRNAs with seed sequences. Red colour shows transcripts without seed sequences but predicted as targets and blue colour – not recognized targets without seed sequence.
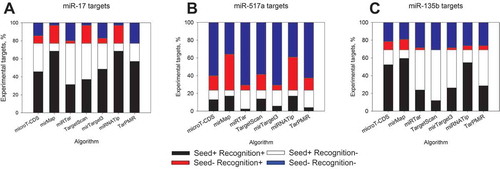
Figure 4. Fraction of experimental miR-17 (a), miR-517a (b), miR-135b (c) and low-throughput-validated miR-17 (d) targets recognized by varying number of target prediction algorithms.