Figures & data
Table 1. Primer sequences.
Table 2. ChIP-qPCR primer sequences.
Figure 1. PIWIL4 was upregulated with RA treatment in NT2 cells. (A) qPCR measurement of early neuronal differentiation marker, Nestin and terminal markers, MAP2 and TUBB3 at different time points of RA treatment in NT2 cells. Fold change is normalized to GAPDH as an internal reference. Expression of PIWI homologs, PIWIL1-4, was evaluated at the transcript level using qPCR (B) and at the protein level by immunoblotting (C). (D) Immunofluorescence staining of PIWIL4 showed nuclear localization in non-treated and RA-treated NT2 cells. 3D: 3-day treatment. 9D: 9-day treatment. Scale bar: 10 μm. The fluorescence intensity was measured by Image J. Bars: mean±sd; n = 9; **p < 0.01 by Student’s t-test.
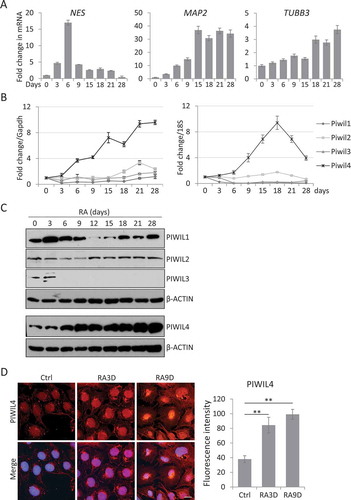
Figure 2. PIWIL4 knockdown suppressed expression of neuronal markers. (A) The knockdown efficiency of three individual siRNAs of PIWIL4 (siPL4-1/2/3) was analysed by RT-PCR. The decimals below the gel strips represent the relative abundance of PIWIL4 to GAPDH as an internal reference. siCtrl: negative control siRNA. (B) NT2 cells were transfected with siPL4-1/2/3 and concurrently treated with RA for 3 days. Immunoblotting was then performed to assess the ESC markers, OCT4 and NANOG, and the early developmental gene HOXA1. (C) qPCR measurement of RA-induced expression of early neuronal genes, NEUROD1 and CYP26A1, in PIWIL4-depleted NT2 cells which were treated with RA for 3 days. (D) The knockdown efficiency of the ON-TARGETplus siRNA pool targeting PIWIL4 (p-siPL4) was assessed by qPCR at different concentrations. (E) Immunoblotting of PIWIL4 in p-siPL4-transfected NT2 cells. The decimals below the gel strips denote the relative abundance of PIWIL4 to β-ACTIN as an internal reference. (F) Immunoblotting of OCT4 and NANOG in RA-treated NT2 cells transfected with the indicated concentration of p-siPL4. (G) Immunoblotting of MAP2 and TUBB3 in p-siPL4-transfected NT2 cells which were treated with RA for 9 days. Bars: mean±sd; n = 4; *p < 0.05, **p < 0.01 by Student’s t-test.
Figure 3. PIWIL4 overexpression increased expression of neuronal markers. The overexpression of PIWIL4 (PL4) was verified by RT-PCR (A). The decimals below the gel strips denote the relative abundance of PIWIL4 to GAPDH as an internal control. VC: vector control (pcDNA3.1-3xHA). The overexpression was confirmed by immunoblotting in NT2 (B) and 293 T cells (C). * in (B) denotes a non-specific immunoreactive band of the HA antibody, which was not seen in 293 T cells (C). (D) Immunoblotting of OCT4 and NANOG in PIWIL4-overexpressing NT2 cells treated with RA for 3 days. (E) Expression of early differentiation markers, HOXA1, NEUROD1 and CYP26A1, was evaluated by qPCR in PIWIL4-overexpressing NT2 cells treated with RA for 3 days. Bars: mean±sd; n = 4; *p < 0.05, **p < 0.01 by Student’s t-test.
Figure 4. PIWIL4 was associated with UTX and involved in histone modification. (A) pcDNA-PIWIL4-HA and pCS2-UTX-F were overexpressed in NT2 cells and immunoprecipitated (IP) with α-HA or α-Myc antibody. The precipitates were immunoblotted (IB) with the indicated antibodies. (B) The endogenous interaction between PIWIL4 and UTX was examined in RA-treated NT2 cells by immunoprecipitation with α-UTX antibody, followed by immunoblotting for PIWIL4. (C) Expression of UTX during RA-mediated neuronal differentiation of NT2 cells was profiled by immunoblotting. The decimals below the gel strips represent the relative abundance of PIWIL4 to β-ACTIN as an internal reference. (D) Immunofluorescence staining of H3K27me3 in RA-treated NT2 cells with or without PIWIL4 knockdown (KD). Scale bar: 10 μm. (E) NT2 cells were transfected with p-siPL4 and treated with RA for 3 days. The protein level of UTX was then determined by immunoblotting. (F) ChIP-qPCR measurement of H3K27me3 in the promoter regions of CYP26A1, NEUROD1, NANOG and OCT4 in NT2 cells treated as indicated. The chromatin binding of H3K27me3 was normalized to IgG. pr: promoter. Bars: mean±sd; n = 4; **p < 0.01 by Student’s t-test.
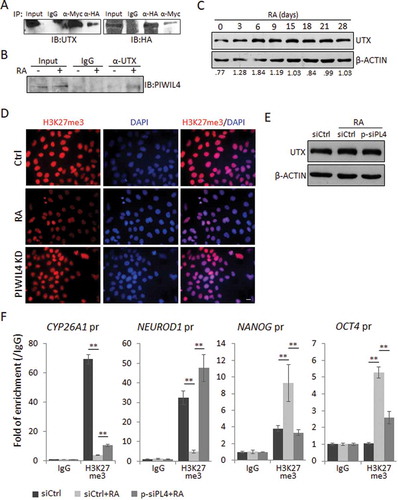
Figure 5. PIWIL4 depletion decreased the expression of critical factors for glioma. Expression of PTN and NLGN3 during RA-mediated neuronal differentiation was profiled at the transcript level by qPCR (A) and at the protein level by immunoblotting (B). dRA: days of RA treatment. (C) Immunoblotting of PTN and NLGN3 in PIWIL4-suppressed NT2 cells which were treated with RA for 9 days. The occupancy of H3K27me3 (H3) at the promoters of PTN and NLGN3 were assessed by ChIP assays followed by PCR amplification (D) and (E) qPCR measurement. In: Input; Ig: IgG in (D). The chromatin binding of H3K27me3 was normalized to Input. pr: promoter. Bars: mean±sd; n = 4; **p < 0.01 by Student’s t-test.
Figure 6. PIWIL4 depletion reduced the proliferation of glioma cells. (A) U87 MG glioma cells were treated for either 2 days or 3 days with the conditioned medium (CM) collected from indicated NT2 cells and subject to MTS viability assays. The gel strips above the bar graph indicate the immunoblotting of NLGN3 and PTN in the CM collected from the numbered samples. – CM: no CM used. (B) NT2 cells were treated with RA and transfected with p-siPL4 together with the plasmid overexpressing either PTN or NLGN3. The CM was then collected and used to treat U87 MG cells for 2 days. The proliferation was assessed by MTS viability assays. Bars: mean±sd; n = 3; **p < 0.01 by Student’s t-test.