Figures & data
Figure 1. Cas12a and Cas12e belong to Class II Type V CRISPR-Cas effectors, subtypes V-A and V-E, correspondingly.
In contrast to Cas12a, Cas12e enzymes require tracrRNA in addition to crRNA for DNA target recognition. crRNA indicated in red, tracrRNA indicated in green. PAM sequences are shown with blue rectangles. SpCas9 – Cas9 from Streptococcus pyogenes (1,368 amino acids), AsCas12a – Cas12a from Acidaminococcus sp. (1,307 amino acids), DpbCas12e – Cas12e from Deltaproteobacteria (986 amino acids). The pairing between DNA and RNA molecules, as well as indicated positions of DNA cleavage sites shown are schematic.
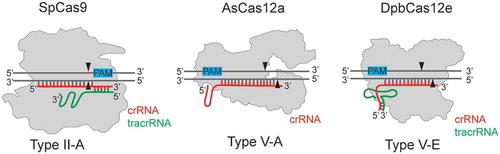
Figure 2. A workflow of sample preparation for determination of positions of DNA cleavage sites produced by Cas nucleases in vitro.
The cleaved DNA fragments generated by Cas nuclease during in vitro DNA cleavage reaction (Step I) are blunted using T4 PNK and T4 DNA polymerase (Step II). A-base is added to 3ʹ ends (Step III) for further ligation of Illumina NEBNext sequencing adaptors containing uridine (Step IV). Uridines are cleaved out using the NEB USER enzyme, which combines uracil DNA glycosylase and endonuclease VIII activity. Next, the samples are barcoded to produce DNA libraries ready for high throughput sequencing.
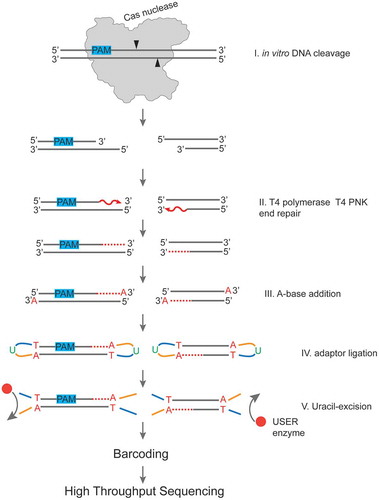
Figure 3. Determination of DpbCas12e, AsCas12a, and SpCas9 cut sites positions by high throughput sequencing of in vitro DNA cleavage reaction products. A) Histograms showing mapping the cut sites on the target and non-target DNA strands in case of DpbCas12e, AsCas12a, and SpCas9. Results for three different DNA targets are shown, PAMs are indicated with red rectangles. The numbering of nucleotide positions starts from the end of the PAM and is shown along the target DNA sequence. For each DNA target sequence, the histograms of cut site positions frequency in percentage for the corresponding DNA strand are shown. Each column represents the fraction of DNA cleavage events after the corresponded nucleotide. ‘NTS’ stands for non-target DNA strand, ‘TS’ – for target DNA strand. The most frequent cut site positions are shown with black triangles. Mean values obtained from three independent experiments with standard deviations are shown. B) The overhang lengths produced by DpbCas12e, AsCas12a, and SpCas9. Histograms of differences between cut site positions on DNA TS and NTS were calculated based on DNA cleavage data obtained for all six targets (panel A and Supplementary Fig. S2). Distances between DSB ends were calculated as Distance = [cut site position on TS] – [cut site position on NTS]. Distances were calculated between all possible TS and NTS DNA cleavage positions. Relative frequencies of generated overhangs were calculated as a sum of [relative frequency of cut site positions on TS] x [relative frequency of cut site positions on NTS] for all combinations of TS and NTS producing overhangs of a certain length.
![Figure 3. Determination of DpbCas12e, AsCas12a, and SpCas9 cut sites positions by high throughput sequencing of in vitro DNA cleavage reaction products. A) Histograms showing mapping the cut sites on the target and non-target DNA strands in case of DpbCas12e, AsCas12a, and SpCas9. Results for three different DNA targets are shown, PAMs are indicated with red rectangles. The numbering of nucleotide positions starts from the end of the PAM and is shown along the target DNA sequence. For each DNA target sequence, the histograms of cut site positions frequency in percentage for the corresponding DNA strand are shown. Each column represents the fraction of DNA cleavage events after the corresponded nucleotide. ‘NTS’ stands for non-target DNA strand, ‘TS’ – for target DNA strand. The most frequent cut site positions are shown with black triangles. Mean values obtained from three independent experiments with standard deviations are shown. B) The overhang lengths produced by DpbCas12e, AsCas12a, and SpCas9. Histograms of differences between cut site positions on DNA TS and NTS were calculated based on DNA cleavage data obtained for all six targets (panel A and Supplementary Fig. S2). Distances between DSB ends were calculated as Distance = [cut site position on TS] – [cut site position on NTS]. Distances were calculated between all possible TS and NTS DNA cleavage positions. Relative frequencies of generated overhangs were calculated as a sum of [relative frequency of cut site positions on TS] x [relative frequency of cut site positions on NTS] for all combinations of TS and NTS producing overhangs of a certain length.](/cms/asset/de7246a4-fd4d-43f5-b122-415d5a8db7dd/krnb_a_1777378_f0003_c.jpg)
Figure 4. The influence of sgRNA spacer length on cleavage by DpbCas12e. A) Results of mapping of in vitro cleavage sites produced in three different DNA targets by DpbCas12e complexed with sgRNAs of different spacer lengths, PAMs are indicated with red rectangles; the numbering of nucleotide positions starts from the end of the PAM and is shown along the target DNA sequence. Heatmaps for each DNA target sequence show the positions of cut sites for the corresponding DNA strand for sgRNAs with indicated spacer lengths. Each heatmap cell intensity represents the fraction of DNA cleavage events after the corresponding nucleotide. The heatmaps are drawn based on mean values obtained from three independent experiments. B) The range of lengths of 5ʹ-overhangs, produced by DpbCas12e in complex with sgRNAs with 16, 18, 20, 22, or 24nt spacers. The differences between cut site positions on DNA TS and NTS were calculated based on data shown in panel A. Distance between DSB ends was calculated as Distance = [cut site position on TS] – [cut site position on NTS]. Distances were calculated between all possible TS and NTS DNA cleavage positions. Relative frequencies of generated overhangs were calculated as a sum of [relative frequency of cut site positions on TS] x [relative frequency of cut site positions on NTS] for all combinations of TS and NTS producing overhangs of a certain length. The most abundant distances of 0–8nt were used to plot a stacked barchart. The length of each sector of the columns represents the fraction of overhangs of certain length.
![Figure 4. The influence of sgRNA spacer length on cleavage by DpbCas12e. A) Results of mapping of in vitro cleavage sites produced in three different DNA targets by DpbCas12e complexed with sgRNAs of different spacer lengths, PAMs are indicated with red rectangles; the numbering of nucleotide positions starts from the end of the PAM and is shown along the target DNA sequence. Heatmaps for each DNA target sequence show the positions of cut sites for the corresponding DNA strand for sgRNAs with indicated spacer lengths. Each heatmap cell intensity represents the fraction of DNA cleavage events after the corresponding nucleotide. The heatmaps are drawn based on mean values obtained from three independent experiments. B) The range of lengths of 5ʹ-overhangs, produced by DpbCas12e in complex with sgRNAs with 16, 18, 20, 22, or 24nt spacers. The differences between cut site positions on DNA TS and NTS were calculated based on data shown in panel A. Distance between DSB ends was calculated as Distance = [cut site position on TS] – [cut site position on NTS]. Distances were calculated between all possible TS and NTS DNA cleavage positions. Relative frequencies of generated overhangs were calculated as a sum of [relative frequency of cut site positions on TS] x [relative frequency of cut site positions on NTS] for all combinations of TS and NTS producing overhangs of a certain length. The most abundant distances of 0–8nt were used to plot a stacked barchart. The length of each sector of the columns represents the fraction of overhangs of certain length.](/cms/asset/51965df1-37cb-4c5a-95d3-8a5f5c72cb0b/krnb_a_1777378_f0004_c.jpg)
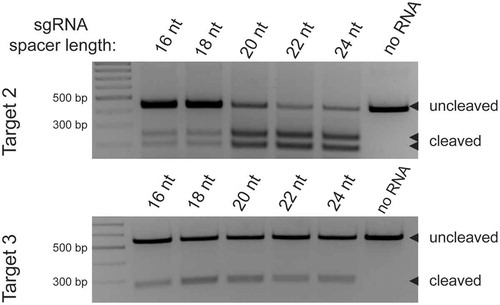
Figure 5. DpbCas12e DNA in vitro cleavage using sgRNAs of different spacer length. Above – a gel showing the results of in vitro cleavage of Target 2 using sgRNAs of 16nt, 18nt, 20nt, 22nt or 24nt spacer length. Below – similar gel for Target 3.