Figures & data
Figure 1. Lm infection has a low impact on total translation activity in LoVo epithelial cells. (A) Principle of the metabolic labelling of newly synthesized proteins with homopropargylglycine (HPG) over an infection time course. LoVo cells, infected or not for 2, 5 or 10 h with Lm LL195 constitutively expressing eGFP, were treated with HPG for 1 h prior to recovery. Cell infection was monitored by immunofluorescence staining on coverslips. DAPI staining of cell nuclei is displayed in white, F-actin staining by fluorescently labelled phalloidin is in red, and eGFP-expressing bacteria are in green. After cell lysis, HPG residues that had been incorporated into newly-synthesized proteins were conjugated with sulpho-Cy5-azide by copper-catalysed alkyne-azide cycloaddition. (B) In-gel fluorescence detection of HPG incorporation into newly synthesized proteins. Following cycloaddition, protein samples were separated by SDS-PAGE, and Cy5 fluorescence was recorded (top panel) before the gel was stained with colloidal Coomassie as a loading control (bottom panel). (C) Quantification of HPG incorporation. The integrated density of Cy5 fluorescence was measured for each lane and normalized to the corresponding integrated density of Coomassie staining. NI, non-infected. Data are average and standard deviation from independent experiments; n = 3 for CHX, 2 and 5 h p.i.; n = 2 for 10 h p.i. p-values were calculated by two-tailed t-tests.
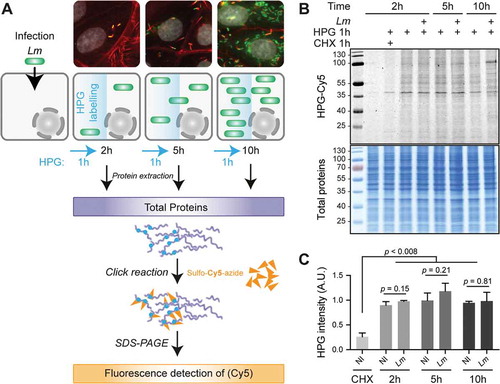
Figure 2. Transcriptional up- & translational down-regulations dominate gene expression response to Lm in the first hours of infection. LoVo intestinal epithelial cells were infected for 2 to 10 h. Cell lysates were processed for total cytoplasmic RNA-seq and ribosome profiling (Ribo-seq). (A-C) Scatter plots of changes in normalized RFP (Y-axis) vs RNA (X-axis) levels along the course of infection, when comparing (A) 2 h vs non-infected, (B) 5 vs 2 h or (C) 10 vs 5 h. (D-E) Volcano plots highlighting genes being significantly up- (right) or down- (left) regulated in (D) RNA-seq, (E) Ribo-seq, or (F) translation efficiency (TE) at 5 h p.i. compared to 2 h p.i. Data points coloured in blue, green or red represent genes with padj below 0.05 (above dashed grey horizontal line; -log10padj = 1.3) and an FC below or above 1.5 (vertical dashed grey lines; log2 FC = ± 0.58). Genes for which padj < 0.5 in TE are highlighted in red in D and E. (A-E) Data from three independent replicates (except for RFPs at 10 h). FC, foldchange; padj, adjusted p-value [DESeq false discovery rate (FDR)].
![Figure 2. Transcriptional up- & translational down-regulations dominate gene expression response to Lm in the first hours of infection. LoVo intestinal epithelial cells were infected for 2 to 10 h. Cell lysates were processed for total cytoplasmic RNA-seq and ribosome profiling (Ribo-seq). (A-C) Scatter plots of changes in normalized RFP (Y-axis) vs RNA (X-axis) levels along the course of infection, when comparing (A) 2 h vs non-infected, (B) 5 vs 2 h or (C) 10 vs 5 h. (D-E) Volcano plots highlighting genes being significantly up- (right) or down- (left) regulated in (D) RNA-seq, (E) Ribo-seq, or (F) translation efficiency (TE) at 5 h p.i. compared to 2 h p.i. Data points coloured in blue, green or red represent genes with padj below 0.05 (above dashed grey horizontal line; -log10padj = 1.3) and an FC below or above 1.5 (vertical dashed grey lines; log2 FC = ± 0.58). Genes for which padj < 0.5 in TE are highlighted in red in D and E. (A-E) Data from three independent replicates (except for RFPs at 10 h). FC, foldchange; padj, adjusted p-value [DESeq false discovery rate (FDR)].](/cms/asset/72fb6347-7c71-4dd8-a7db-382182022c08/krnb_a_1777380_f0002_c.jpg)
Figure 3. Early transcriptional regulation of inflammatory response precedes a translational repression of the translational equipment. (A) Over-representation analysis (ORA) of GO Biological Process terms for up- or down-regulated genes in RNA-seq, Ribo-seq or TE over all time-points. For each time-point, DRGs were selected by comparison to the non-infected condition. (B-F) Induction of inflammation and of the integrated stress response by Lm infection of LoVo cells. The variation of RNA (B, D) and RFP (C, E) levels was quantified for selected NF-κB transcriptional target genes related to inflammation (B, C) or genes involved in the integrated stress response (D, E) during infection. Data represent DESeq normalized read counts from three independent experiments and error bars indicate standard deviation. (F) The phosphorylation status of the mTOR substrate S6K1, and of the target of ISR eIF2 kinases eiF2α were assessed by immunoblotting in cells infected for 2, 5 or 10 h by wild-type Lm or by an Lm strain where the hlyA gene encoding LLO had been deleted (∆hlyA). Treatments by tunicamycin and rapamycin were used, respectively, as an inducer of the ISR through endoplasmic reticulum stress, and as a repressor of mTOR activity. (G) Transcripts sharing similar TE profiles over time were clustered by fuzzy clustering. For each cluster, only genes having more than 70% membership are displayed. (H) Functional categories were assigned to each cluster by ORA of GO Biological Process terms.
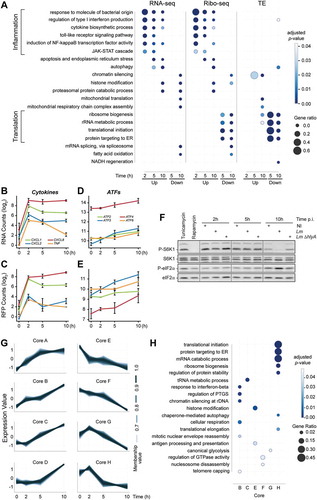
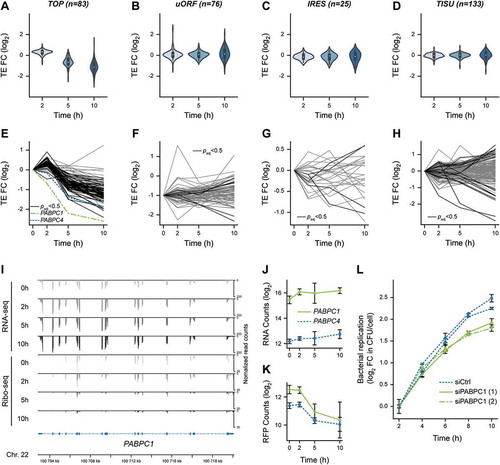
Figure 4. Translational repression of 5ʹ-terminal oligopyrimidine-containing transcripts, including PABPC1, during Lm infection. (A-D) Violin plots representing fold changes in TE over time for transcripts that have been experimentally verified to contain (A) functional TOP, (B) uORF, or (C) IRES motifs, or (D) predicted to contain a TISU in their 5ʹ-UTR regions. (E-H) Translation efficiency profiles of individual transcripts containing either (E) TOP, (F) uORF, (G) IRES or (H) TISU motifs. Transcripts for which the adjusted p-value from Riborex analysis was below 0.5 are displayed in black line (except PABPC1 and PABPC4, in dotted green and blue lines, respectively), while transcripts for which TE changes were not significant are displayed in grey. (I) Profiles of RNA-seq (top) and Ribo-seq (bottom) reads aligned at the PABPC1 locus. Average values of read counts per genomic position from three independent experiments, normalized for library size, are represented for each time-point. (J-K) Quantification of the variation of PABPC1 and PABPC4 RNA (J) and RFP (K) levels during infection. Data represent DESeq normalized counts from three independent experiments and error bars indicate standard deviation. (L) Silencing of PABPC1 reduces Lm intracellular replication rate. LoVo cells were transfected with siRNA against PABPC1 mRNA or a scrambled siRNA (siCtrl) for 48-h before infection. Two independent experiments were carried out using distinct siRNA against PABPC1 (siPABPC1 (1) and (2)). Bacterial entry and replication were assessed by gentamicin protection assay followed by serial dilution plating of infected cell lysates on agar plates. In order to focus on intracellular multiplication rather than differences in the entry, the log2 ratio of colony-forming units (CFU) counts per cell at each time-points relative to time 2 h post-infection were plotted. Values are averages and standard deviation from three infected wells per condition, each counted thrice.