
Figures & data
Figure 1. miR-21 levels in nerve tissues and Schwann cells. A: miR-21 expression in the model group, sham operation group and blank group mean±SD, n = 3, ** P < 0.01 vs sham operation group or blank group. B: miR-21 expression in the mimic-miR-21 group, control-miR-21 group and RSC96 group mean±SD, n = 3, * P < 0.05 vs control-miR-21 group or RSC96 group. C: Transfected Schwann cells; C-a: fluorescence microscope 40×; C-b: Common microscope 40 ×.
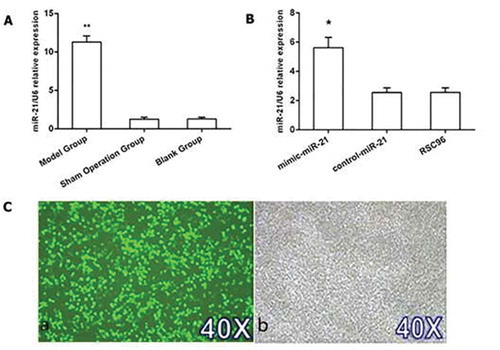
Figure 2. miR-21 promoting Schwann cell proliferation. A: A450 values detected by CCK-8 in the mimic-miR-21 group, control-miR-21 group and RSC96 group mean±SD, n = 3, * P < 0.05, ** P < 0.01 vs control-miR-21 group or RSC96 group. B: The influence of miR-21 on the cell cycle of Schwann cells detected by Flow cytometer %, Mean ± SD, n = 3, ** P < 0.01 vs control-miR-21 group or RSC96 group, PI: proliferation index.
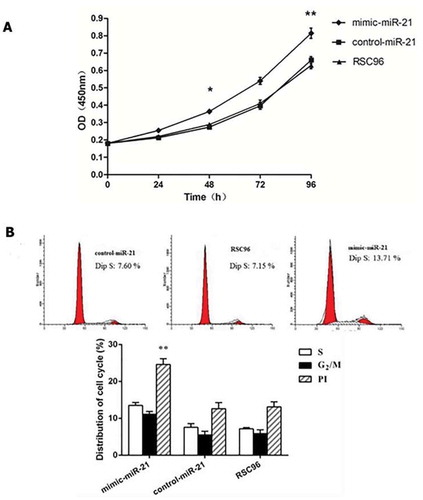
Figure 3. Extraction of DRGns and detection of DRGn purity. A: After the skin is cut open, the soft tissue around the spine is stripped to expose the spine completely. B: After the spine is cut open and the whole spinal cord is picked out, circular and semi-transparent spinal dorsal root ganglions are visible in both-side intervertebral foramina. C: After 7-day culture, the morphology of DRGns is observed under an inverted phase-contrast microscope. D: After purification, the red fluorescence (NF-200 staining) indicates DRGns. E: After purification, the blue fluorescence (DAPI staining) indicates nuclei. F: A merged image of D and E. DRGns: Dorsal root ganglion neurons.
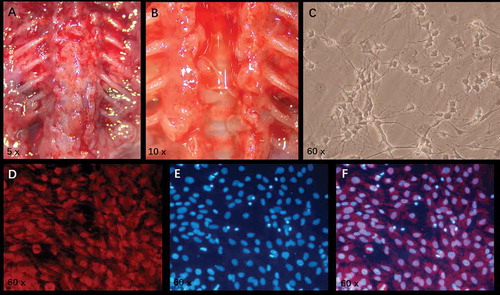
Figure 4. Comparison of axonal length after 7-day coculture under a confocal microscopy. A, B and C: photographs of axon in the mimic-miR-21 group, control-miR-21 group and RSC96 group, respectively. D: Comparison of the longest axon length of a single cell between the three groups E: Comparison of the total axon lengths of a single cell between the three groups. mean±SD, n = 3, *P < 0.05 vs control-miR-21 group or RSC96 group; Scale bar: 30 µm.
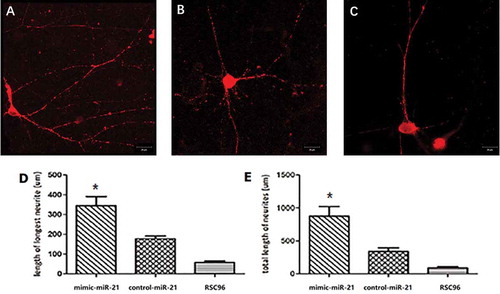
Figure 5. Apoptosis detected by flow cytometry. A, B and C: Apoptosis in the mimic-miR-21 group, control-miR-21 group and RSC96 group, respectively. D: The apoptotic percentage is significantly lower in the mimic-miR-21 group than in the control-miR-21 group and RSC96 group mean±SD, n = 3, * P < 0.05 vs control-miR-21 group and RSC96 group. Q4 quadrant: living cells; Q3 quadrant: early apoptotic cells; Q2 quadrant: late apoptotic cells, Q1 quadrant: mechanical injured cells.
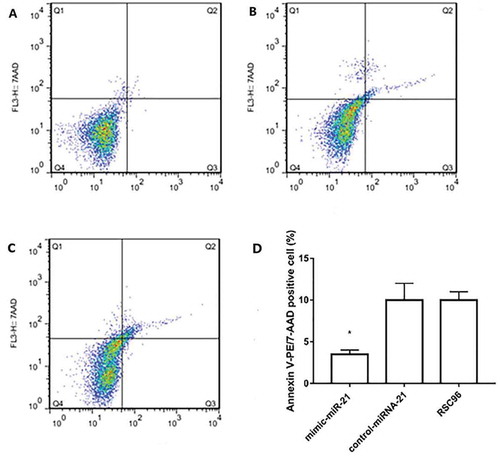
Figure 6. Expressions of TGFβI, CCND1, TIMP3, EPHA4 and caspase-3/caspase-9. A: mRNA and protein expressions of TGFβI and protein expression of CCND1 in the mimic-miR-21 group, control-miR-21 group and RSC96 group. B: mRNA and protein expressions of TIMP3 and protein expressions of caspase-3 and caspase-9 in the mimic-miR-21 group, control-miR-21 group and RSC96 group. C: mRNA and protein expressions of EPHA4 in the mimic-miR-21 group, control-miR-21 group and RSC96 group mean±SD, n = 3, * P < 0.05 vs control-miR-21 group and RSC96 group.
Figure 7. Relative luciferase expression.A: Comparison of luciferase activity between the cells transfected by mimic-miR-21 and the cells transfected by control-miR-21 in TGFβI 3ʹ-UTR-WT and 3ʹ-UTR-MUT group. B: Comparison of luciferase activity between the cells transfected by mimic-miR-21 and the cells transfected by control-miR-21 in TIMP3 3ʹ-UTR-WT and 3ʹ-UTR-MUT group. C: Comparison of luciferase activity between the cells transfected by mimic-miR-21 and the cells transfected by control-miR-21 in EPHA4 3ʹ-UTR-WT and 3ʹ-UTR-MUT group mean±SD, n = 3, P < 0.05 vs the cells transfected control-miR-21. D: The binding sites of miR-21 with TGFβI, TIMP3 and EPHA4. The targetscan indicates that the binding sites of miR-21 with TGFβI, TIMP3 and EPHA4 exist at 405–429 bp (AUAAGCUA), 2307–2331 bp (AUAAGCUA) and 2211–2246 bp (AUAAGCUA) in the 3ʹUTR (non-coding region) of TGFβI, TIMP3 and EPHA4, respectively.
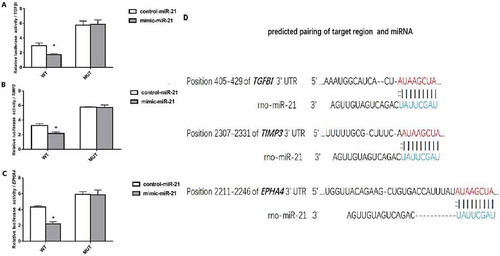
Figure 8. Expressions of TGFβI, TIMP3 and EPHA4 in vivo in the mimic-miR-21 group, control-miR-21 group and RSC96 group, respectively (×100).
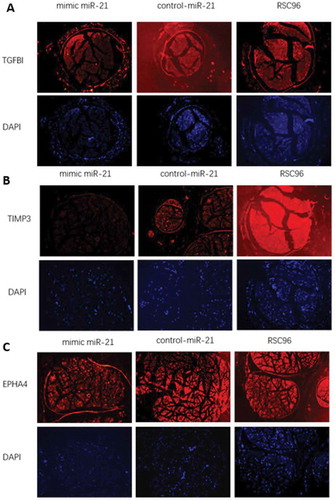
Table 1. Primer sequences of miR-21, TGFβI, TIMP3, EPHA4, U6 and GAPDH for qRT-PCR.
Figure 9. Co-culture system of DRGns and SCs. The mixture of DRGns and matrigel are seeded in the lower chamber, and SCs are seeded in the upper chamber. DRGns: dorsal root ganglion neurons; SCs: Schwann cells.
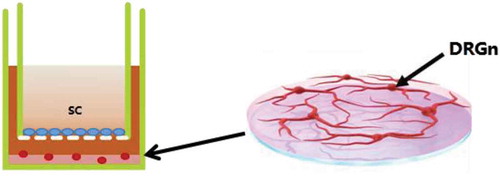
Table 2. Sequences of mimic-miR-21, control-miR-21 as well as TGFβI, TIMP3 and EPHA4 reporter gene vectors.