
Figures & data
Figure 1. Identification of lncRNAs transcriptionally induced/repressed by oestrogen signalling in ER+ breast cancer cells.
A-B. Volcano plots showing the differential expression of lncRNAs upon E2 stimulation in MCF7 cells detected by RNA-seq (A) or GRO-seq (B). C-D. The differential expression oflncRNAs detected by GRO-seq were re-mapped for their expression changes using RNA-seq data (C) or vice versa (D). In all panels, each dot represents one gene. The green dots are lncRNAs that are significantly downregulated by E2. The red dots are lncRNAs upregulated by E2. E. Venn diagram showing the overlap of the lncRNAs withdifferential E2 responsiveness detected by either RNA-seq or GRO-seq. F. Heatmap of all the E2-actived orE2-repressed lncRNAs that could be detected by both RNA-seq and GRO-seq. From all the analyses in C-F, 33 E2-actived lncRNAs and 14 E2-repressed lncRNAs were identified and their gene names were listed in F.
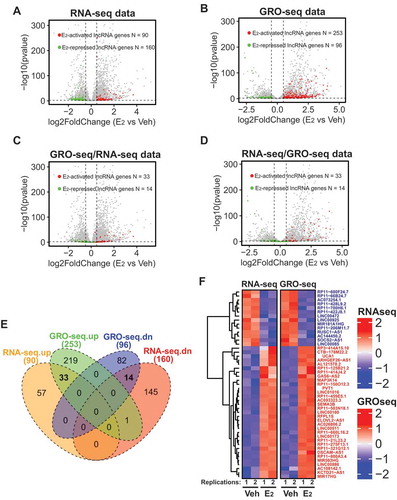
Figure 2. Expression of oestrogen-regulated lncRNAs correlates with eRNA production of neighbouring ERα enhancers.
A-B. Genome browser snapshot images of ChIP-seq and GRO-seq signals at ERα-bound regions (shadow marked) around one representative E2-activated gene LINC00160 (A) and one representative E2-repressed gene SOCS2-AS1 (B). From the snapshot images, we can see that the transcriptional activities at enhancers and at target gene bodies are positively correlated (see changes in bi-directional eRNA expression level and changes in lncRNA gene body expression upon E2 stimulation), suggesting that oestrogen activates or represses both ERα enhancers (eRNA) and the adjacent lncRNA genes in the same direction. C-D. Aggregate plots for GRO-seq tag density showing both sense (plus) and anti-sense (minus) eRNA expression levels for the ERα enhancers in MCF7 cells (vehicle vs E2treatment for 1 hour). There are 151 ERα enhancers associated with E2-activated lncRNAs (C) and 54 ERα enhancersassociated with E2-repressed lncRNAs (D). E2 treatment in MCF7 cells significantly increased eRNA transcriptionat the 151 ERα enhancers but repressed eRNA transcriptionat the 54 ERα enhancers. The regions around ± 2kb centred on ERα-bound peaks were used for aggregation plot analyses in C and D. In both C and D, there are two GRO-seq replications.
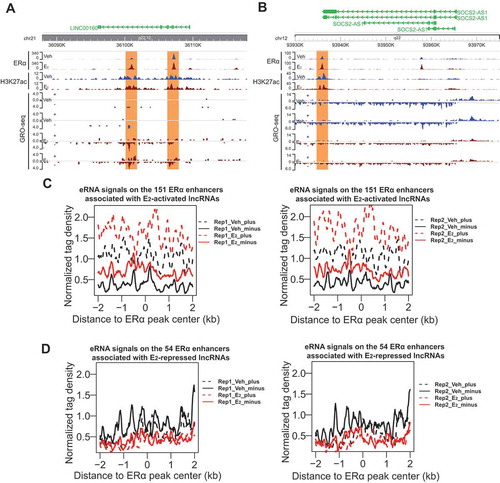
Figure 3. Transcription of oestrogen-regulated lncRNAs is associated with the presence of enhancer complex.
A-F.Aggregate plots showing the change of normalized tag density of the ChIP-seq data of ERα (A), Η3Κ27ac (B), P300 (C), MED1 (D), ARID1B (E), and ATAC-seq data (F) upon E2 stimulation for the 151 ERα enhancers associated with E2-activated lncRNAs sites (left panel) or the 54 ERα enhancers associated with E2-repressed lncRNAs sites (right panel). The results show although the binding of ERα was significantly enhanced on both two groups of enhancers upon E2 stimulation, the enhanced binding of epigenetic cofactors P300, MED1 and ARID1B were only found for the 151 ERα enhancers associated with E2-activated lncRNAs sites.The E2-enhanced chromatin accessibility detected by ATAC-seq was also only found for the 151 ERα enhancers associated with E2-activated lncRNAs sites.G-H.Genome browser views of ChIP-seq signals for ERα, Η3Κ27ac, P300, MED1, and ARID1B and of ATAC-seq signals on one representative E2-activated gene LINC00160 (G) and one representative E2-repressed gene SOCS2-AS1 (H).
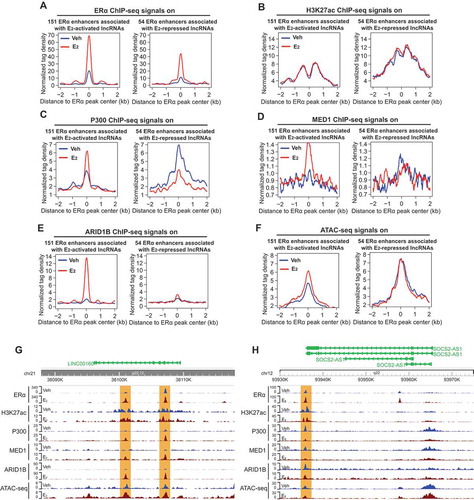
Figure 4. LINC00160 and RUNX1 are co-regulated by E2 and are located within one TAD.
A. The genome browser views of Pol II ChIA-PET signals and various epigenomics-based sequencing data for the chromatin region that contains both LINC00160 and RUNX1. Top: Schematic diagram showing the promoter-enhancer interactions between regions around the LINC00160and RUNX1 measured by Pol II ChIA-PET (n = 2, biological replicates).Bottom: The ChIP-seq data of ERα, Η3Κ27ac, P300, MED1, ARID1B as well as the ATAC-seq, GRO-seq and RNA-seq data around the LINC00160 (marked with yellow shadow) and RUNX1 (marked with green shadow) loci in MCF7 cell line. The results demonstrate a coordinated E2-induction for both LINC00160 and RUNX1 andstrong interactions between the RUNX1 promoter and several ERα enhancers located inside LINC00160 gene. B. Heatmap (top) and schematic diagram (bottom) representing chromatin interactions within 500kb regions covering LINC00160 and RUNX1 measured by Hi-C experiments in the T47D cell line (+- E2). The Hi-C results suggest that oestrogen enhances the promoter-enhancer interactions between LINC00160 and RUNX1 and these two genes are regulated as a 3D structural unit supported by a TAD domain that containing both LINC00160 and RUNX1 loci.
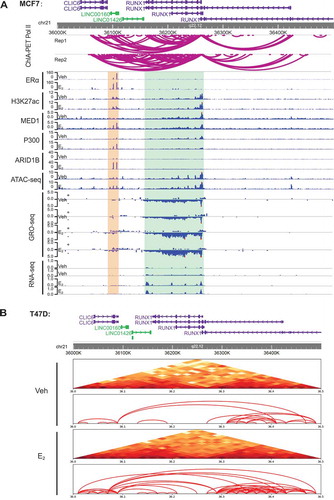
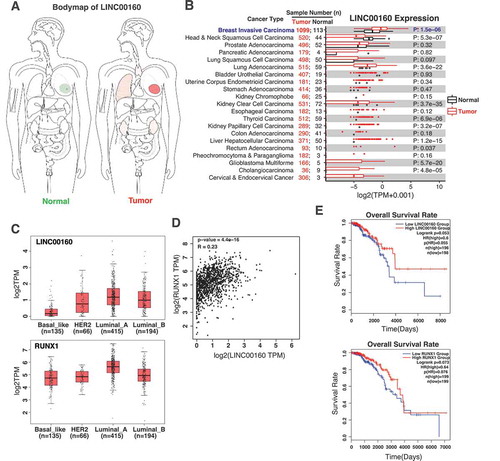
Figure 5. The levels of LINC00160 and RUNX1 correlate with the disease outcome in ER+ breast cancer patients.
A. The bodymap of LINC00160 expression levels in the paired normal(left) vs tumour tissues(right) for different organs. B. The comparison of LINC00160 expression between normal and tumour tissues in different cancer types using TCGA dataset, showing the higher expression of LINC00160 in breast cancers. C. The expression of LINC00160 and RUNX1 in different subtypes of breast cancer using TCGA dataset, demonstrating both LINC00160 and RUNX1 express at higher levels in ER+ luminal breast cancers. D. Correlation of LINC00160 and RUNX1 expression in breast cancer. E. Negative correlation between the expression level ofLINC00160 or RUNX1 and the survival rate of ER+ breast cancer patients.TCGA RNA-seq data from breast cancer samples were used in the analyses. The results in A, D, and E were generated with GEPIA website [Citation51].
Supplemental material