Figures & data
Table 1. The identified and highly expressed circRNAs in each brain region
Figure 1. The highly expressed circRNA in four brain regions. (A) Venn diagrams of highly expressed circRNAs in each brain region. The shared and distinct circRNAs are shown as the number and percentage. (B) The 3D PCA of highly expressed circRNAs that exists in at least 1 brain regions, the axes show the first, second and fourth principal components
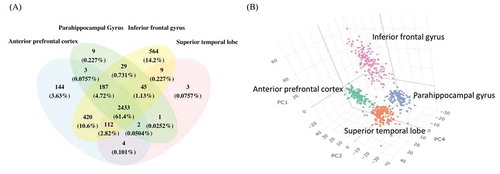
Figure 2. Heatmap of significantly DE circRNAs in brain regions based on CDR. The colour legends on top of the heatmap show the CDR stages and the brain region. The grey area in the plot means the circRNA is not significantly DE in that region
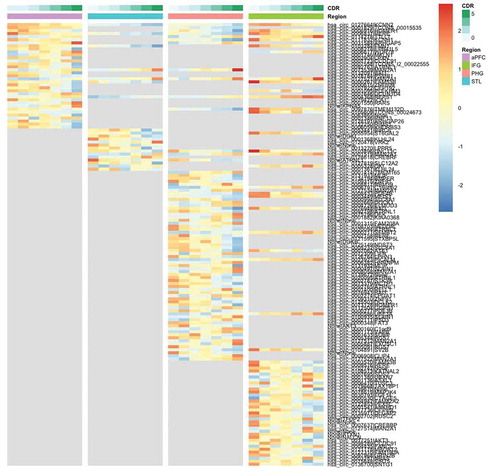
Figure 3. The circRNA-mRNA co-expressed modules in parahippocampal gyrus. (A) represents the correlation of circRNA-mRNA co-expressed modules clustered by WGCNA in the parahippocampal gyrus and three traits, CDR, AOD and SEX. The numbers in the heatmaps are the correlation coefficients and the P value in the parentheses. (B) shows the topological overlap of the co-expressed modules. Each column and row is a transcript and the colour bands on the top and left represent the modules. The deeper coloured regions in the network matrix correspond to more topological overlap (i.e. higher intra-module similarity of the members). The dendrograms on top and left show the clustering of the transcripts
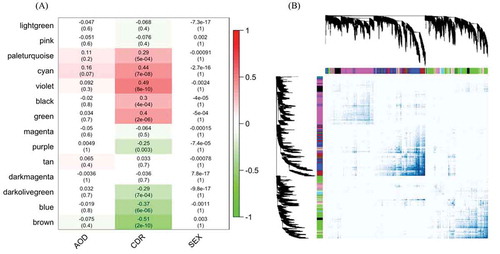
Figure 4. The circRNA-mRNA co-expressed network of the brown module in Parahippocampal gyrus. The same network colour coded by either (A) biological pathway, and (B) disease ontology enrichment term. The circle represents the circRNAs and the triangle represents the genes. In order to provide a brief overview, only those circRNAs and mRNAs with log2 fold-change ≥0.2 & FDR ≤0.05 are included, only edges with weights ≥0.2 are shown, and mRNA–mRNA interactions are excluded
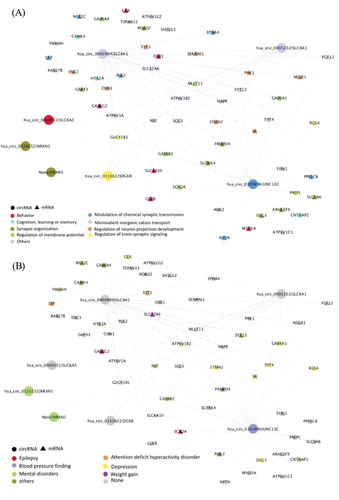
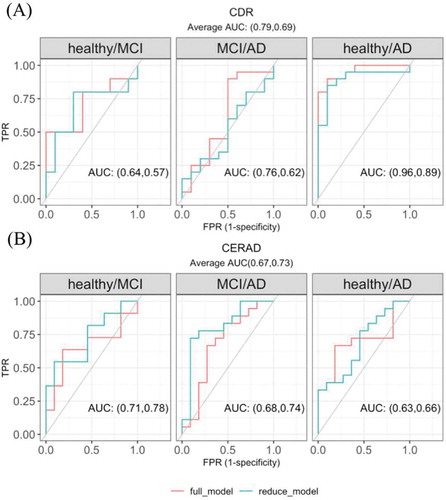
Figure 5. The multivariate regression model with circRNA candidates in predicting (A) CDR and (B) CERAD state. The reduced model included covariates sex, age of death, batch and the first three principal components calculated from the circRNA expression level. The full model further included the five significantly DE circRNAs with the highest average AUC in the univariate regression models (the five circRNAs used in predicting CDR state were shown in Supplementary Fig 6, the five used in predicting CERAD were not shown)