Figures & data
Table 1. The clinical characteristics of the NSCLC patients in this study
Table 2. The primer sequences for Real-Time qPCR
Figure 1. The expression status of circ-LDLRAD3 and miR-137 in clinical specimens and NSCLC cell lines. The cancer tissues and their paired adjacent normal tissues were collected from 60 NSCLC patients. Real-Time qPCR was conducted to determine the levels of (A) circ-LDLRAD3 and (B) miR-137 in clinical tissues collected from NSCLC patients. (C) Pearson correlation analysis was performed to analyse the correlation between circ-LDLRAD3 and miR-137 in NSCLC tissues. Real-Time qPCR was employed to detect the levels of (D) linear LDLRAD3 mRNA (normalized by β-actin), (E) circ-LDLRAD3 and (F) miR-137 in NSCLC cell lines (A549, H1299 and Calu-3) and human bronchial epithelial cell line (HBE), respectively. Each experiment repeated at least 3 times. *p < 0.05, **p < 0.01
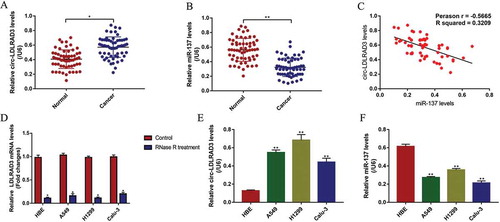
Figure 2. The expression levels of circ-LDLRAD3 and miR-137 in NSCLC tissues collected from patients with different clinicopathological features. Circ-LDLRAD3 was high-expressed in patients with (A) high-grade TNM stage and (B) lymphatic metastasis. MiR-137 levels were determined by Real-Time qPCR in NSCLC patients with different (C) TNM stages and (D) lymphatic metastasis status. Each experiment repeated at least 3 times. *p < 0.05, **p < 0.01
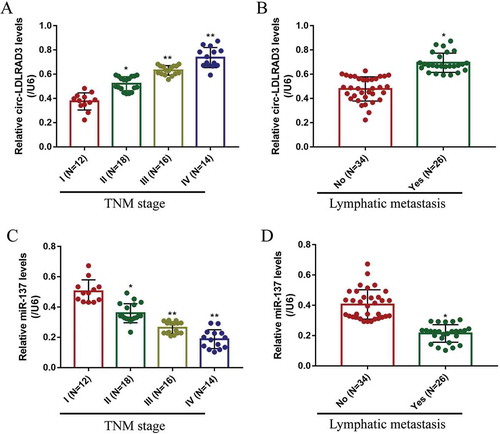
Figure 3. Circ-LDLRAD3 affected cell apoptosis, proliferation and invasion in NSCLC cell lines. The NSCLC cell lines (A549 and H1299) were transfected with circ-LDLRAD3 overexpression and knock-down vectors, respectively. (A, B) FCM was used to examine cell apoptosis ratio in NSCLC cells. (C, D) CCK-8 assay was employed to detect NSCLC cell proliferation. (E, F) Transwell assay was performed to examine cell invasion abilities in NSCLC cells. Each experiment repeated at least 3 times. *p < 0.05, **p < 0.01 and ‘NS’ represented ‘No statistical significance’
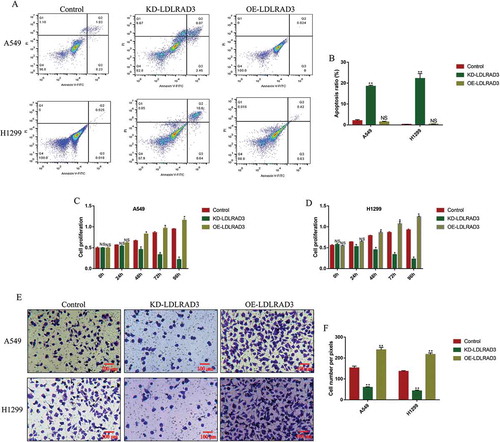
Figure 4. MiR-137 inhibited NSCLC cell proliferation. (A, B) The NSCLC cells (A549 and H1299) were transfected with miR-137 mimic and inhibitor, respectively, cell proliferation was determined by using CCK-8 assay. Western Blot was employed to determine the expression levels of proliferation associated proteins (Cyclin D1, CDK2 and p27) in (C, D) A549 cells and (E, F) H1299 cells, respectively. Each experiment repeated at least 3 times. *p < 0.05, **p < 0.01
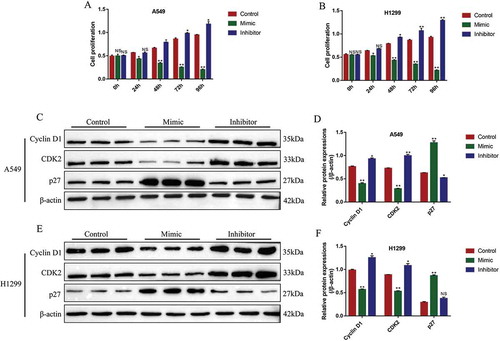
Figure 5. The influences of miR-137 on NSCLC cell apoptosis and epithelial-mesenchymal transition (EMT). The NSCLC cells (A549 and H1299) were transfected with miR-137 mimic and inhibitor, respectively. The apoptosis associated proteins (cleaved Caspase-3, Bax and Bcl-2) were determined by Western Blot in (A, B) A549 cells and (C, D) H1299 cells. The biomarkers for EMT (N-cadherin and Vimentin) were measured in (E, F) A549 cells and (G, H) H1299 cells. Each experiment repeated at least 3 times. **p < 0.01
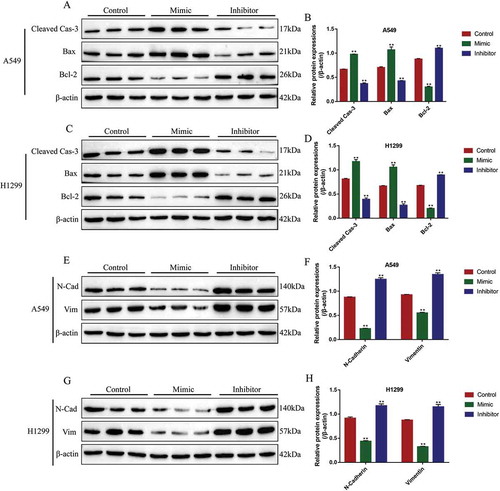
Figure 6. The regulating mechanisms of circ-LDLRAD3, miR-137 and SLC1A5. (A) The online starBase software was used to predict the targeting sites of circ-LDLRAD3 and miR-137. (B) Dual-luciferase reporter gene system was used to verify the binding sites of circ-LDLRAD3 and miR-137. (C, D) Overexpression of circ-LDLRAD3 inhibited miR-137 levels in NSCLC cells, and knock-down of circ-LDLRAD3 had opposite effects. (E) The binding sites of miR-137 and 3ʹ UTR regions of SLC1A5 mRNA were predicted. (F, G) Dual-luciferase reporter gene system was used to verify the binding sites of miR-137 and 3ʹ UTR regions of SLC1A5 mRNA. (H, I) Real-Time qPCR was employed to explore the effects of miR-137 on SLC1A5 mRNA levels in NSCLC cells. (J, K) MiR-137 overexpression inhibited SLC1A5 protein levels in NSCLC cells, while knock-down of miR-137 had the opposite effects. Each experiment repeated at least 3 times. **p < 0.01 and ‘NS’ represented ‘No statistical significance’
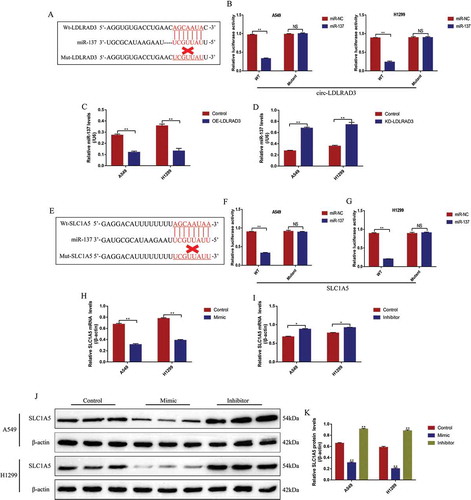
Figure 7. Circ-LDLRAD3 regulated SLC1A5 by sponging miR-137 in NSCLC cells. (A, B) SLC1A5 was positively regulated by circ-LDLRAD3 in NSCLC cells (A549 and H1299). (C, D) The expression levels of SLC1A5 mRNA were regulated by circ-LDLRAD3 through miR-137 in NSCLC cells. (E, F) Western Blot was conducted to determine the expression levels of SLC1A5 protein in NSCLC cells. (G) The expression status of SLC1A5 mRNA in the cancer tissues and adjacent normal tissues collected from NSCLC patients. The Pearson correlation analysis was performed to determine the correlations between (H) SLC1A5 mRNA and circ-LDLRAD3, and (I) SLC1A5 mRNA and miR-137, respectively. Each experiment repeated at least 3 times. *p < 0.05, **p < 0.01 and ‘NS’ represented ‘No statistical significance’
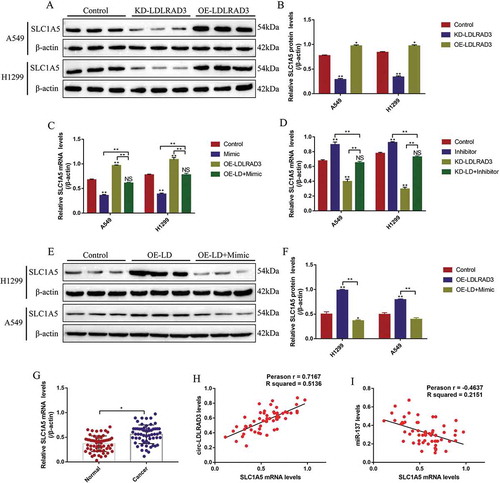
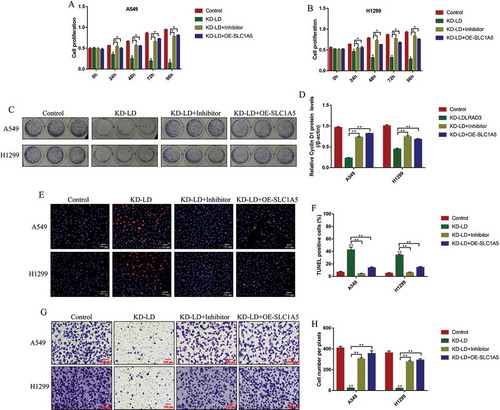
Figure 8. Knock-down of Circ-LDLRAD3 regulated cell functions in NSCLC cells by regulating miR-137/SLC1A5 axis. NSCLC cell proliferation was determined by CCK-8 assay in (A) A549 cells and (B) H1299 cells. (C, D) Colony formation assay was employed to evaluate the colony formation abilities in NSCLC cells. (E, F) TUNEL assay was performed to detect cell apoptosis in NSCLC cells (A549 and H1299). (G, H) The cell invasion abilities for A549 and H1299 cells were determined by Transwell assay. Each experiment repeated at least 3 times. *p < 0.05, **p < 0.01