Figures & data
Figure 1. Domain structure and key PTMs of human La protein (hLa, 408 aa)
RRM = RNA Recognition Motif; green box = RiboNucleoProtein (RNP) motif; RCD = RNA chaperone domain (amino acids required for RCD-1 activity are located in the loop 3 and the 53 helix of RRM1) [Citation29,Citation52,Citation53]; NRE = Nuclear Retention Element [Citation31,Citation34,Citation35]; NoLS = Nucleolar Localization Signal [Citation32,Citation33]; NLS = Nuclear Localization Signal [Citation31]; D = Dimerization domain [Citation42]; IDR = Internal Disordered Region [Citation54]; PTM = PostTranslational Modification; S = Sumoylation site [Citation111,Citation113]; P = Phosphorylation site [Citation29,Citation37,Citation100,Citation101].
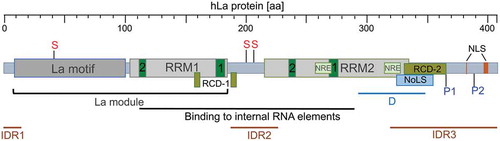
Figure 2. Kaplan Meyer survival curves suggest elevated expression of hLa mRNA as indicator for poor cancer prognosis
The conclusion that high hLa mRNA expression correlates with low survival is drawn from: A) The neuroblastoma data set SEQC-498 consists of 498 cases including 487 patient samples with low (red) La and 11 with high (blue) La mRNA expression levels, leading to a significant difference (p = 0,027). B) The lung adenocarcinoma data set TCGA-515 consists of 515 cases including 187 patient sample with low (red) La and 328 with high (blue) La mRNA expression levels, leading to a significant difference (p = 0,0033). C) The acute myeloid leukaemia data set Bohlander-422 consists of 422 cases including 335 patient sample with low (red) La and 87 with high (blue) La mRNA expression levels, leading to a significant difference (p = 0,0045). Datasets and Kaplan Meier curves were derived from the R2Platform (https://r2.amc.nl). Red lines = low La mRNA expression; blue lines = high La mRNA expression.
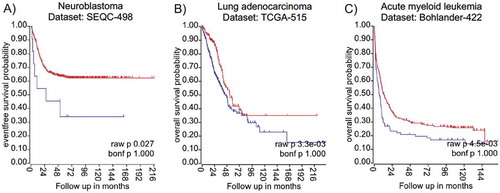
Figure 3. Alteration frequency of the human La in different cancer entities
Human La gene alteration frequency found in different cancer entities. Top 10 cancer types are shown. Bars indicate type of gene alteration: Green = Point mutation; Red = Amplification; Purple = Fusion; Blue = Deep Deletion; Gray = Multiple Alterations. The Top 10 cancer types shown; A and B are adapted graphs derived from cBioPortal (www.cbioportal.org). Data were retrieved from: https://www.cbioportal.org. using the gene symbol SSB.
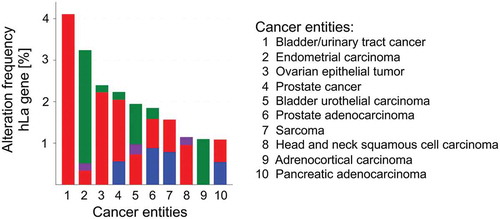
Figure 4. Human La gene alterations
Lollipop diagram indicating the distribution of common gene alterations in the open reading frame of the hLa gene. The phosphorylation site T389 is changed to R389 in colon cancer (red arrow). The diagram is based on data obtained from 44,366 patients included in 176 studies. The somatic mutation frequency is 0.2%. Sixty-one missense mutation (green dots), 29 truncating mutations (black dots, including nonsense, non-stop, frameshift deletion, frameshift insertion, splice site mutations), 4 inframe deletions or insertions mutations (brown dots) and 6 mutations of other types (purple dots) are shown. The y-axis shows how often the mutation was found in this patient cohort. Data were retrieved from: https://www.cbioportal.org. using the gene symbol SSB.
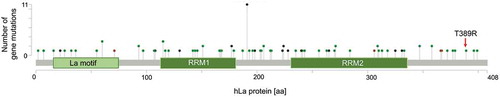
Figure 5. Posttranslational modifications (PTM) in the human La protein
Published PTMs are indicated such as sumoylation site K41 and K208 (red arrows) and phosphorylation site S366 and T389 (blue arrows). Most of those PTM sites have been identified by high-throughput mass spectrometry. (Adapted from www.phosphosite.org). Red stars indicated identified gene alterations leading to changes in the indicated PTM sites.
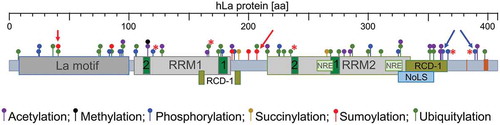
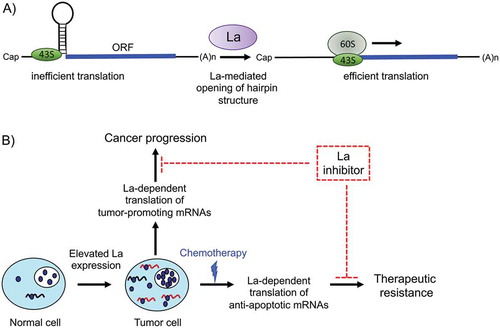
Figure 6. A model for the role of human RNA-binding protein La in cancer progression and therapeutic resistance
A) The RNA chaperone La facilitates translation of mRNAs harbouring hairpin structures in close proximity to the translational start site. An RNA hairpin acts as a road block for the scanning ribosomal 43S subunit. Upon La-assisted helix destabilization of the RNA hairpin, the 43S subunit reaches the translational start site, formation of the 80S ribosome occurs and mRNA translation starts. B) The model is based on the assumption that La facilitates the translation of mRNA regulons encoding factors implicated in cancer pathobiology (tumour-promoting mRNAs) and survival (anti-apoptotic mRNAs). Blocking the binding of La to selective mRNAs may impair cancer progression and the ability of cancer cells to cope with cellular stress under chemotherapeutic treatment. ORF: Open Reading Frame.