
Figures & data
Table 1. Primers used for ChIP experiments
Figure 1. Knockdown of IGF2BP2 increased BTB permeability in vitro
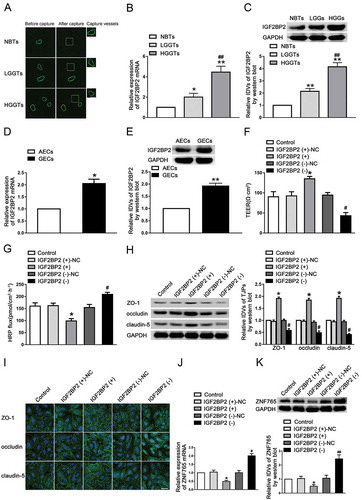
Figure 2. Knockdown of FBXL19-AS1 increased BTB permeability in vitro
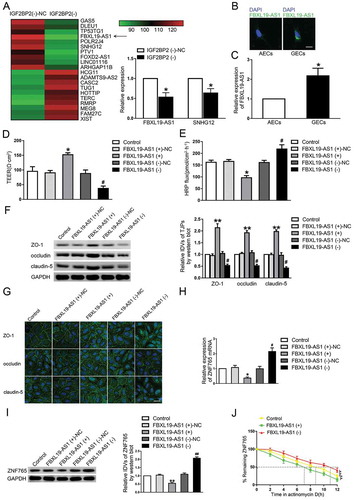
Figure3 Upregulation of IGF2BP2 increased FBXL19-AS1 stability, FBXL19-AS1 participated in the process of IGF2BP2 regulating BTB permeability
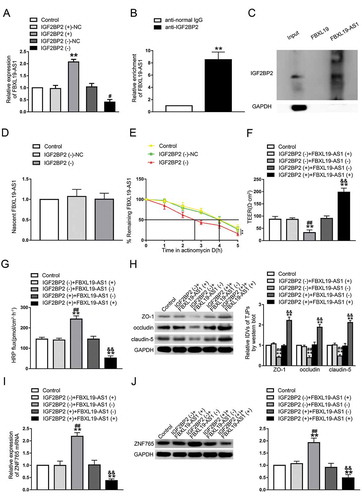
Figure 4. Overexpression of ZNF765 increased BTB permeability in vitro
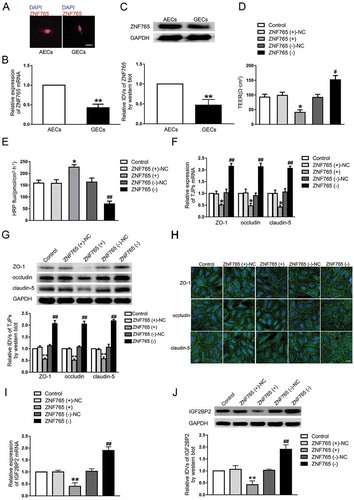
Figure 5. FBXL19-AS1 negatively regulated ZNF765 expression through SMD pathway
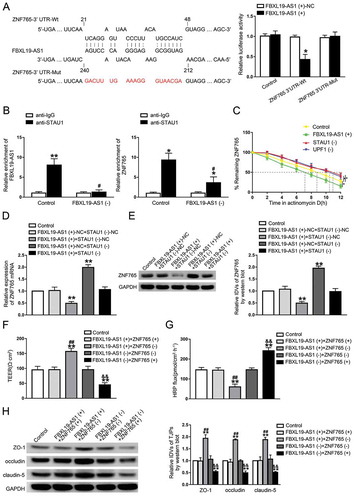
Figure 6. ZNF765 bound to ZO-1, occludin, claudin-5 and IGF2BP2 promoters and inhibited their expressions at the transcriptional level
Figure 7. IGF2BP2 knockdown combined with FBXL19-AS1 knockdown increased the effect of DOX in promoting apoptosis of U87 cells
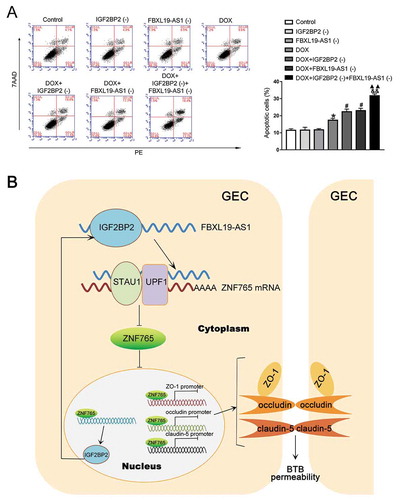
Table 2. Primers used for qRT-PCR to detect IGF2BP2, FBXL19-AS1 and ZNF765