
Figures & data
Figure 1. Characteristics of mutation-induced aberrant 3ʹ and 5ʹ splice sites that resulted in genetic disease. (a, b) Total number of cryptic and de novo 5’ss (a) and 3’ss (b) in DBASS. (c) Location of aberrant splice sites. (d, e) Proportion of multiple aberrant 5’ss (d) and 3’ss (e) activated by a single mutation. (f) The intrinsic strength of aberrant 5ʹ and 3’ss and their authentic counterparts. Their numbers are shown in panels (a) and (b). Whiskers/boxes denote quartiles, black lines denote medians. P values for the indicated comparisons of mean ME scores were derived by unpaired t-tests. T-values were 13.01 (5’ss) and 7.85 (3’ss)
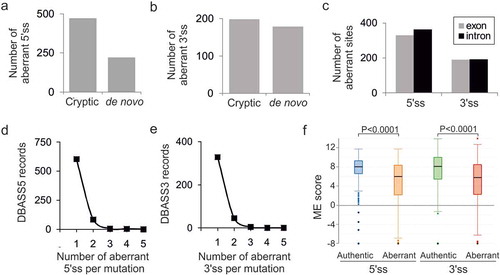
Figure 2. Intron and exon size constraints that hold back strong contenders. Location of 92 pairs of strong-cryptic (S) and weak-authentic (W) splice sites in introns (left) and exons (right). Their location is denoted by circles. For each pair, the ME score of cryptic site was higher than for its authentic counterpart (Table S1). Activation of each cryptic site resulted in human genetic disease (Table S1). Introns are denoted by horizontal lines, exons by boxes. WT, MUT; wild-type and mutated splice sites, respectively. Asterisk, mutation; X, splice-site repression; √, splice-site activation. The total number of S-W pairs in each group (N) is shown to the left. The number of aberrant 3’ss (top) or aberrant 5’ss (bottom) with small (≤100 nt) adjacent exons (left) or small (≤200 nt) adjacent introns (right) is in red; their proportions are in parentheses. Size-restricted segments are in orange
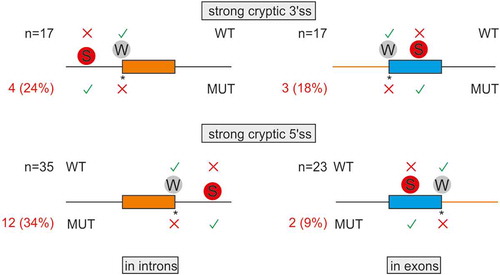
Table 1. Summary of TEs detected in new DBASS3 records
Table 2. Summary of TEs detected in new DBASS5 records
Figure 3. New TE clusters as substrates for aberrant splice site activation. (a,b) Mutation-induced exonization of the LTR78-AluJ cluster in F8 intron 18. (a) Schematics of mutation-induced pseudoexon splice sites located in separate TEs. Canonical exons are denoted by black boxes, pseudoexon by a grey box. Exon length is in nucleotides below. A scale at the bottom is in kilobases (kb). Mutation (asterisk) activated the pseudoexon via a de novo 5’ss, leading to mild haemophilia A [Citation62]. Dotted lines above and below the pre-mRNA indicate aberrant and canonical splicing, respectively. (b) Sequences around pseudoexon splice sites. Splice sites are denoted by a slash. A putative branch point adenine in LTR78 (boxed) was predicted by the SVM-BP algorithm [Citation73]; the disease-causing mutation is underlined. Sequences in blue and red are derived from LTR78 and AluJ, respectively. (c,d) Mutation-induced exonization of a LINE and MER58A cluster in COL4A5. (c) Schematics of mutation-induced splice sites activated in separate TEs. For full legend, see panel (a). (d) Sequences around pseudoexon splice sites. Sequences in blue are derived from a LINE-1 copy, sequences in orange from a MER58A copy. Mutation (asterisk) creating the 3’ss AG led to pseudoexon activation, causing Alport syndrome [Citation63]
![Figure 3. New TE clusters as substrates for aberrant splice site activation. (a,b) Mutation-induced exonization of the LTR78-AluJ cluster in F8 intron 18. (a) Schematics of mutation-induced pseudoexon splice sites located in separate TEs. Canonical exons are denoted by black boxes, pseudoexon by a grey box. Exon length is in nucleotides below. A scale at the bottom is in kilobases (kb). Mutation (asterisk) activated the pseudoexon via a de novo 5’ss, leading to mild haemophilia A [Citation62]. Dotted lines above and below the pre-mRNA indicate aberrant and canonical splicing, respectively. (b) Sequences around pseudoexon splice sites. Splice sites are denoted by a slash. A putative branch point adenine in LTR78 (boxed) was predicted by the SVM-BP algorithm [Citation73]; the disease-causing mutation is underlined. Sequences in blue and red are derived from LTR78 and AluJ, respectively. (c,d) Mutation-induced exonization of a LINE and MER58A cluster in COL4A5. (c) Schematics of mutation-induced splice sites activated in separate TEs. For full legend, see panel (a). (d) Sequences around pseudoexon splice sites. Sequences in blue are derived from a LINE-1 copy, sequences in orange from a MER58A copy. Mutation (asterisk) creating the 3’ss AG led to pseudoexon activation, causing Alport syndrome [Citation63]](/cms/asset/8096f41f-3583-4ce2-8048-28d54904afff/krnb_a_1805909_f0003_c.jpg)
Figure 4. TEs can contribute only a portion of traditional splicing elements and can be activated by distant mutations. (a,b) A LINE fragment contributing the 5ʹ part of the predicted branch point sequence of the GPR143 pseudoexon. (a) Schematics of the mutation-induced pseudoexon. For full legend, see ). Blue horizontal rectangle denotes the the 3ʹ end of L1MD3. Black arrow denotes BPS. (b) Sequences around pseudoexon splice sites. (c,d) AluY as a source of the BPS, PPT and 3’ss of a CEP290 pseudoexon. (c) Schematics of the mutation-induced pseudoexon. Horizontal red arrow denotes a full-length AluY copy. For full legend, see . (d) Sequences around pseudoexon splice sites
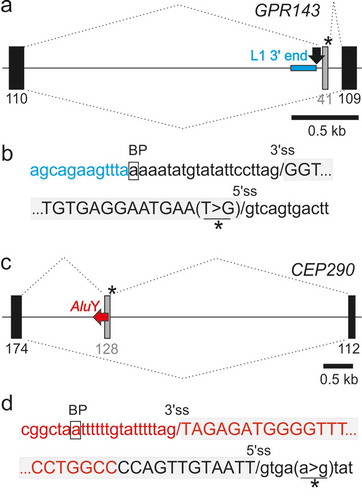
Table 3. Genomic context of adenines with differential DMS reactivities between WT and mutant F8.
Table 4. Enhancer activities of the SHAPE-predicted triloop
Figure 5. Structural probing of a composite LTR78/AluJ exon activated in the F8 gene. (a,b) Denaturing polyacrylamide gels with a dideoxynucleoside triphosphate-generated stops (left) run in parallel with primer extension reactions for the WT (a) and mutant (b) F8 probes in the presence (+) and absence (-) of DMS. FL, full-length transcript. Predicted AluJ-derived apical tetraloop/stem is boxed/underlined. (c) Normalized DMS reactivities for WT and mutant F8 RNAs. Columns are means and error bars are SDs, as calculated from 2 independent experiments. Asterisks denote significant decline of DMS reactivities in the mutant (P < 0.05, ANOVA with Tukey’s post-hoc test); negative values were cut off at −2. The mutated residue (F8 c.5998 + 530 C > T) that activated an intronic 5’ss and caused haemophilia [Citation62] is in red. (d) Sequence alignment of the human 7SL RNA gene (RNA7SL1), Repbase AluJb consensus [Citation102] and the exonized left arm of the AluJ copy in F8 intron 18. Three orange dots separate the 5ʹ (1–80) and 3ʹ (262–299) termini of 7SL RNA that gave rise to mammalian free left Alu monomers [Citation30,Citation66]. Conserved adenines with differential DMS reactivities in the exonized left arm of the F8 AluJ are in red. The pseudoexon is highlighted in grey. The exonized left arm of F8 AluJ and corresponding 7SL RNA sequences are ~70% identical
![Figure 5. Structural probing of a composite LTR78/AluJ exon activated in the F8 gene. (a,b) Denaturing polyacrylamide gels with a dideoxynucleoside triphosphate-generated stops (left) run in parallel with primer extension reactions for the WT (a) and mutant (b) F8 probes in the presence (+) and absence (-) of DMS. FL, full-length transcript. Predicted AluJ-derived apical tetraloop/stem is boxed/underlined. (c) Normalized DMS reactivities for WT and mutant F8 RNAs. Columns are means and error bars are SDs, as calculated from 2 independent experiments. Asterisks denote significant decline of DMS reactivities in the mutant (P < 0.05, ANOVA with Tukey’s post-hoc test); negative values were cut off at −2. The mutated residue (F8 c.5998 + 530 C > T) that activated an intronic 5’ss and caused haemophilia [Citation62] is in red. (d) Sequence alignment of the human 7SL RNA gene (RNA7SL1), Repbase AluJb consensus [Citation102] and the exonized left arm of the AluJ copy in F8 intron 18. Three orange dots separate the 5ʹ (1–80) and 3ʹ (262–299) termini of 7SL RNA that gave rise to mammalian free left Alu monomers [Citation30,Citation66]. Conserved adenines with differential DMS reactivities in the exonized left arm of the F8 AluJ are in red. The pseudoexon is highlighted in grey. The exonized left arm of F8 AluJ and corresponding 7SL RNA sequences are ~70% identical](/cms/asset/4cd8d1e3-27b7-401f-87fa-750dfd196f82/krnb_a_1805909_f0005_c.jpg)
Figure 6. SHAPE reactivities for WT and mutated F8 transcripts. (a) SHAPE gels with NAI-modified WT and mutant RNA probes that visualize their 3ʹ (left panel) and 5ʹ (right panel) portions. (b) Normalized NAI reactivities (upper panel) and PU values (lower panel) for identical RNA segments
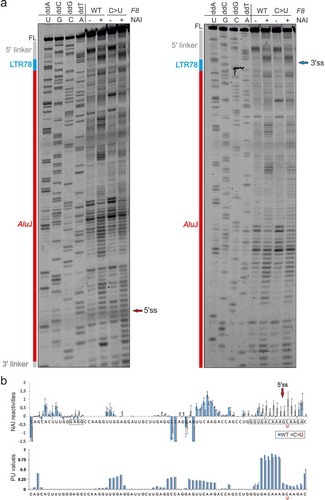
Figure 7. Comparison of the secondary structure of 7SL RNA within the Alu domain of SRP and SHAPE-guided structures of WT and mutated LTR78/AluJ RNAs. (a) Secondary structure of 7SL RNA within the Alu domain of SRP [Citation65,Citation66,Citation99]. Helices (H) and loops (L) in orange are numbered according to a previously published topology [Citation99]. The central stem (H3) is also known as helix 5 in the unifying nomenclature of all SRPs (circled) [Citation67], stem V [Citation68] or stem III [Citation65]. Lower case letters indicate RNA sequences that are absent in the left Alu arm consensus [Citation65] ()). The C > U mutation is denoted by a black arrow. Blue and pink rectangles denote the central stem portions that are most similar to the F8 AluJ structure and were derived from the 5ʹ and 3ʹ parts of 7SL RNA, respectively. Conserved adenines with differential DMS reactivities in WT and mutated F8 probes are in red. (b,c) SHAPE-guided secondary structure of the WT (b) and mutant (c) LTR78/AluJ RNAs. Normalized DMS and NAI reactivities (colour coded as indicated) are shown in . Black triangles indicate major RNase A cleavage sites (numbered 1–7); their size indicates normalized cleavage intensities in the WT (Fig. S1). In the mutant (c), triangle sizes indicate changes in relative cleavage intensities as compared to the WT; red triangles denote >3-fold differences between the mutant and WT. The linkers and RT primers are highlighted in grey. Alternative structures are shown in Fig. S2. Decoy and active 5’ss are marked by closed and open green triangles, respectively. Secondary structures in panels (b) and (c) were predicted by RNAstructure [Citation103] using normalized NAI constraints and default options. d Alignment of existing sense AluJ exons that employ the same decoy 5’ss as the F8 AluJ copy. The 5’ss are denoted by a slash. Dashes are alignment gaps; three orange dots separate the 5ʹ and 3ʹ parts of 7SL RNA that gave rise to Alu-like elements [Citation30,Citation66]. Full sequences of sense Alus that use 5’ss homologous to that activated in the AluJ copy in F8 are in Table S2. Their alignment is in Figure S3
![Figure 7. Comparison of the secondary structure of 7SL RNA within the Alu domain of SRP and SHAPE-guided structures of WT and mutated LTR78/AluJ RNAs. (a) Secondary structure of 7SL RNA within the Alu domain of SRP [Citation65,Citation66,Citation99]. Helices (H) and loops (L) in orange are numbered according to a previously published topology [Citation99]. The central stem (H3) is also known as helix 5 in the unifying nomenclature of all SRPs (circled) [Citation67], stem V [Citation68] or stem III [Citation65]. Lower case letters indicate RNA sequences that are absent in the left Alu arm consensus [Citation65] (Figure 5(d)). The C > U mutation is denoted by a black arrow. Blue and pink rectangles denote the central stem portions that are most similar to the F8 AluJ structure and were derived from the 5ʹ and 3ʹ parts of 7SL RNA, respectively. Conserved adenines with differential DMS reactivities in WT and mutated F8 probes are in red. (b,c) SHAPE-guided secondary structure of the WT (b) and mutant (c) LTR78/AluJ RNAs. Normalized DMS and NAI reactivities (colour coded as indicated) are shown in Figs. 5 and 6. Black triangles indicate major RNase A cleavage sites (numbered 1–7); their size indicates normalized cleavage intensities in the WT (Fig. S1). In the mutant (c), triangle sizes indicate changes in relative cleavage intensities as compared to the WT; red triangles denote >3-fold differences between the mutant and WT. The linkers and RT primers are highlighted in grey. Alternative structures are shown in Fig. S2. Decoy and active 5’ss are marked by closed and open green triangles, respectively. Secondary structures in panels (b) and (c) were predicted by RNAstructure [Citation103] using normalized NAI constraints and default options. d Alignment of existing sense AluJ exons that employ the same decoy 5’ss as the F8 AluJ copy. The 5’ss are denoted by a slash. Dashes are alignment gaps; three orange dots separate the 5ʹ and 3ʹ parts of 7SL RNA that gave rise to Alu-like elements [Citation30,Citation66]. Full sequences of sense Alus that use 5’ss homologous to that activated in the AluJ copy in F8 are in Table S2. Their alignment is in Figure S3](/cms/asset/393af31f-ab7b-472d-9751-14d6a33c2cf8/krnb_a_1805909_f0007_c.jpg)