Figures & data
Figure 1. Receiver operating characteristic curve for sRNA prediction. Panel A shows the ROC curve for sRNA prediction performance by the PredsRNA program in genic and non-genic category. A total of 1174 sRNA, 5870 genic, and 5870 non-genic non-sRNA sequences were considered to measure the performance. Panel B and C shows the performance of sRNA prediction by PredsRNA and RNAz programs in genic and non-genic categories, respectively. A total of common 334 sRNA, 1670 genic, and 1670 non-genic non-sRNA sequences were considered to measure the performance
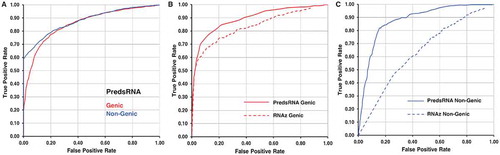
Figure 2. Prediction of sRNA targets. Panel A demonstrates the sRNA-mRNA target binding region identification protocol (Component I) of PredTAR. The main aim of this protocol is to identify the un-pairing probability of each base from both sRNA and mRNA sequences and utilize this probability information to identify the binding region. Panel B describes the Component II protocol used by PresRAT to identify the sRNA-mRNA target binding region. In this protocol, the energetic value of both sRNA and mRNA secondary structures are taken into account to identify binding regions
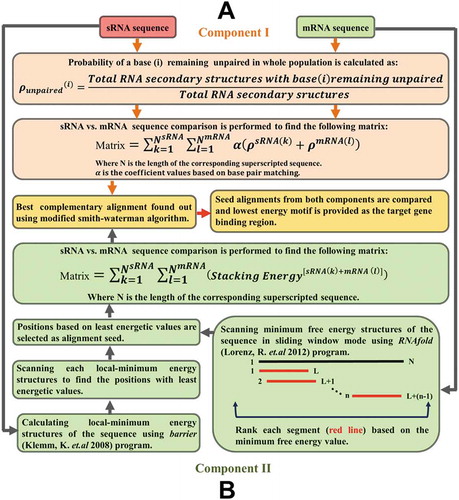
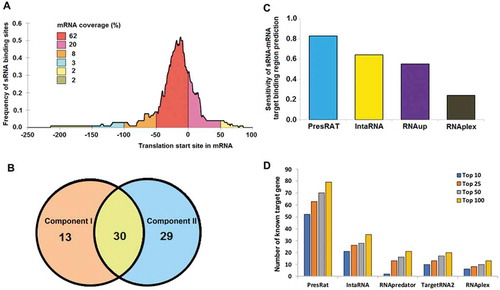
Figure 3. sRNA target finding performance. Panel A shows the frequency distribution of sRNA binding sites in the 91 mRNA sequences. In 98% of the cases, it is found that the sRNA binding site is present within the window of −250 to +100 nucleotides (0 being the translation initiation site) of the target gene. Panel B shows the overlap of correctly predicted target by the PresRAT Component I and II protocols, respectively. Panel C shows the PresRAT sensitivity in predicting the correct sRNA-mRNA target binding regions in 88 samples compared to other programs. Panel D shows the number of true sRNA target gene identification through whole-genome search by PresRAT compared to other existing programs