
Figures & data
Table 1. lncRNA gene candidates
Figure 1. Genomic characterization of lncRNA candidates
UCSC Genome Browser tracks depicting mouse gene variants (red) with PhyloP conservation tracks shown below (dark blue- conserved, red- not conserved). PhyloCSF results presented in green (positive strand), show negative coding potential for all three frames available. Bottom panel tracks indicate mouse inner ear RNA-seq coverage. An E16.5 cochlea sample is presented as an example. The rest of the samples demonstrated the same pattern of expression. The thick boxes in the PLAR tracks represent the longest ORFs of each variant. (A) Gas5, (B) 2700046G09Rik, (C) 1810014B01Rik (also presenting the negative (red) strand for PhyloCSF), and (D) Xloc_012867.
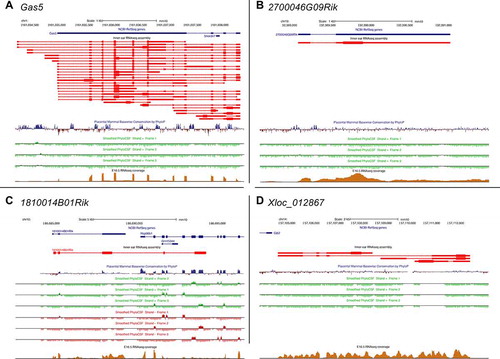
Figure 2. Expression of lncRNAs in the inner ear
E16.5 (upper panel) and P0 (bottom panel) mouse inner ear sensory epithelia samples examined for Gas5, Xloc_012867 and 2700046G09Rik expression (green). Pvab expression (hair cells marker, red), Npy expression (inner pillar cells marker, grey) and DAPI (blue) were used as controls. Upper panels for each age indicate all four labels, while the lower panels indicate only the lncRNA expression in greyscale. Insets indicate higher magnification views of the organ of Corti. IHC (inner hair cells), OHC (outer hair cells). Scale bars: main panels = 50 µm, insets = 20 µm.
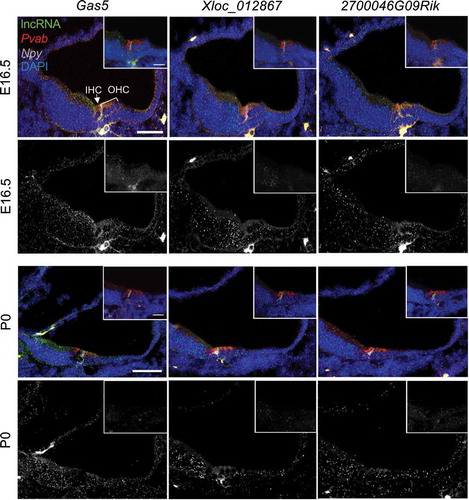
Figure 3. Expression of lncRNA candidates in different cells types of the inner ear
Expression of Gas5, 2700046G09Rik, and 1810014B01Rik in the indicated cell types based on single cell RNA-seq data [Citation21] at the indicated developmental time points: (A) E14, (B) E16, (C) P1, and (D) P7. Size of each circle indicates percent of cells for each cell type expressing the indicated lncRNA. Colour code indicates scaled (z-score) average expression in each cell. BM (basement membrane), DC (Deiters’ cells), DC1/2 (Deiters’ cells rows 1 and 2), DC 3 (Deiters’ cells row 3), GER (greater epithelial ridge), GER/Hmgn2 (greater epithelial ridge/Hmgn2 expressing cells), HC (hair cells), IHC (inner hair calls), IPC (inner pillar cells), IPhC (inner phalangeal cells), IS (inner sulcus cells), KO (Kölliker’s organ cells), Lateral KO (lateral Kölliker’s organ cells), Lateral KO.1 (lateral Kölliker’s organ cells type 1), Lateral KO.2 (lateral Kölliker’s organ cells type 2), Lateral KO.3 (lateral Kölliker’s organ cells type 3), Lateral pro. (Lateral prosensory), LER (lesser epithelial ridge), LER2 (lesser epithelial ridge type 2), LER/Bmp4.1 (lesser epithelial ridge/BMP4 type 1 expressing cells), LER/Bmp4.2 (lesser epithelial ridge/BMP4 type 2 expressing cells), LER/Fst (lesser epithelial ridge/Fst expressing cells), Medial KO (medial Kölliker’s organ cells), Med. Lat. KO (medial lateral Kölliker’s organ cells), Medial pro. (Medial prosensory), Oc90 (Otoconin90 expressing cells), Oc90.3 (Otoconin90 type 3 expressing cells), Oc90.4 (Otoconin90 type 4 expressing cells), Oc90/Ota (Otoconin90/Otoa expressing cells), Oc90/Sparcl1 (Otoconin90/Sparcl1 expressing cells), OHC (Outer hair cells), OPC (outer pillar cells), Os/Claudius (outer sulcus cells/Claudius), Ube2c+ (Ube2c expressing cells).
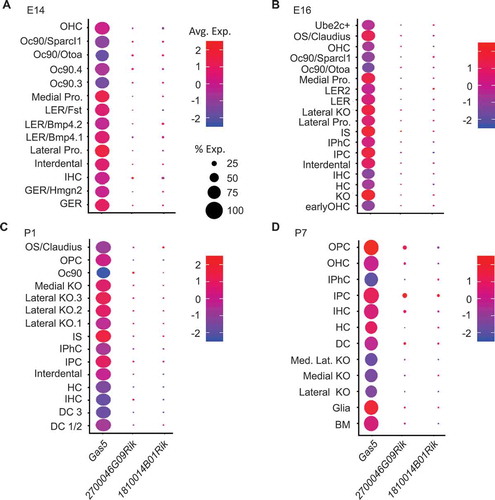
Figure 4. lncRNA sub-cellular localization
lncRNA expression in the cytoplasmic and nuclear fractions of N2a cells measured by qRT-PCR, presented as cytoplasmic vs. nuclear fractions mean initial quantity ±SEM, n = 3. Malat1, known to be localized to the nuclear fraction, served as a control.
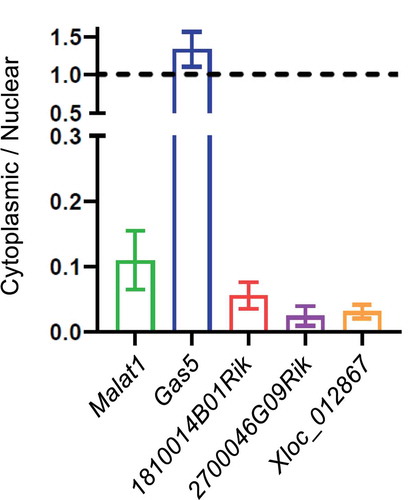
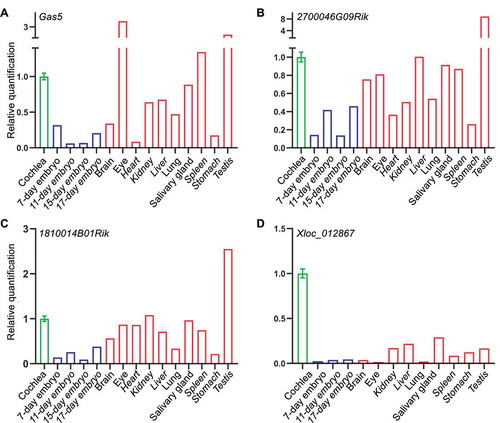
Figure 5. lncRNA expression in a mouse tissue panel, using qRT-PCR
(A) Gas5, (B) 2700046G09Rik, (C) 1810014B01Rik, and (D) Xloc_012867. Mean ± SEM, n = 3. Error bars are presented for the cochlea only as the source of the rest of the samples is the Mouse Total RNA Master Panel (Clontech).
Supplemental material