Figures & data
Figure 1. Comparison of the susceptibilities of E. coli tRNAArg isoacceptors to colicin D. (A) In vitro transcripts for E. coli tRNAArg isoacceptors used in this study are presented as a clover-leaf structure. All these transcripts possess G1-C72 and G2-C71 pairs to enhance the transcription efficiency. Nucleotide numbering is according to the proposal of Sprinzl [Citation12]. Arrowheads indicate the cleavage sites of colicin D. Note that the modified base inosine is introduced in the first letter of anticodon of tRNAArgACG. (B) Each of the four 3′-labelled E. coli tRNAArg transcripts was incubated with various amounts of D-CRD as indicated, and the cleavage efficiency was compared. The extent of cleavage was calculated according to the following equation. The extent of cleavage (%) = 100 × band intensity of the cleaved fragment/(band intensity of the intact tRNA + band intensity of the cleaved fragment). Arrowhead indicates the cleaved fragments
![Figure 1. Comparison of the susceptibilities of E. coli tRNAArg isoacceptors to colicin D. (A) In vitro transcripts for E. coli tRNAArg isoacceptors used in this study are presented as a clover-leaf structure. All these transcripts possess G1-C72 and G2-C71 pairs to enhance the transcription efficiency. Nucleotide numbering is according to the proposal of Sprinzl [Citation12]. Arrowheads indicate the cleavage sites of colicin D. Note that the modified base inosine is introduced in the first letter of anticodon of tRNAArgACG. (B) Each of the four 3′-labelled E. coli tRNAArg transcripts was incubated with various amounts of D-CRD as indicated, and the cleavage efficiency was compared. The extent of cleavage was calculated according to the following equation. The extent of cleavage (%) = 100 × band intensity of the cleaved fragment/(band intensity of the intact tRNA + band intensity of the cleaved fragment). Arrowhead indicates the cleaved fragments](/cms/asset/9ef11729-0d91-40ed-bd5d-0ac6f049c7cd/krnb_a_1838782_f0001_c.jpg)
Figure 2. Determination of nucleotides important for the susceptibility to D-CRD within the anticodon-loop. (A) Secondary structures of the anticodon stem-loop (ASL) transcripts for E. coli tRNAArgs used are as shown. All these ASL transcripts possess GG extension at their 5′ termini to enhance the transcription efficiency. Arrows indicate the nucleotide replacement, and nucleotide numbering is according to those of full-length tRNAs as seen in . Arrowheads correspond to the cleavage sites of ASLArgACG, as seen in Fig. 2D. (B, C, E, and F) Each of the nucleotides was replaced as indicated, and the susceptibility to D-CRD was evaluated. Arrowheads indicate the cleaved 3′ fragments. (D) Cleavage site on ASLArgACG was determined. The 5′-labelled ASLArgACG was incubated without (lane 1) or with D-CRD (lane 3). The alkaline hydrolysis ladder was loaded on lane 2. The cleavage site is depicted by a closed arrowhead, and the minor cleavage site, which probably occurs indirectly, is denoted by an open arrowhead
Figure 3. Structural insight of substrate recognition and catalytic mechanism of colicin D. (A) Docking model of D-CRD595 with ASL for tRNAArgICG was shown. The structure of D-CRD595 was obtained from the D-CRD595∙ImmD complex determined by our group (PDB code: 1TFO), and ASL was generated based on the structure of yeast tRNAPhe (PDB code: 1EHZ). (B) The active site of D-CRD boxed in (A) was magnified and amino acid residues of D-CRD involved in substrate recognition/catalysis, as well as bases of G36, A38, and C39 of ASL for tRNAArgICG, were labelled. The 2′-O and 3′-O of A38 were also indicated. (C) Docking model of tRNA∙D-CRD was constructed by superposing the structure of yeast tRNAPhe onto that of ASL in ASL∙D-CRD shown in (A). Structures of ASL, tRNA, and D-CRD are coloured orange, light orange, and blue, respectively. D-arm of tRNA is labelled in red in (C)
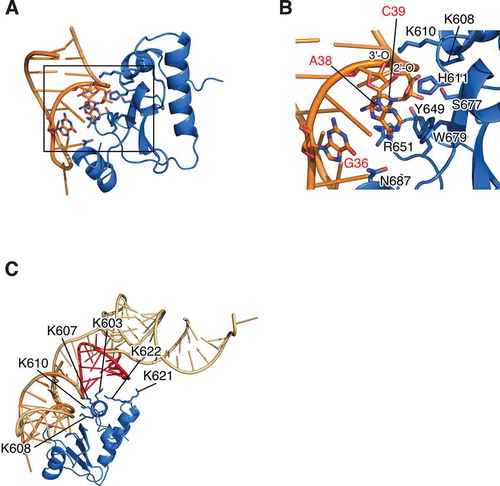
Figure 4. Correlation of intracellular level of tRNAArgICG and viability of cells challenged with colicin D. (A and B) Each of the four isoaccepting tRNAArgs and their C32U mutants was overexpressed in the wild-type E. coli cells, and these cells were challenged with colicin D. Subsequently, the status of tRNA prepared from these cells was analysed with northern blot hybridization, as depicted in (A). Simultaneously, viable cell count (CFU) was calculated and represented in (B). U* indicates a modified base of mnm5U appearing in the anticodon of tRNAArgmnm5UCU. The values shown in the histogram were a mean of three independent experiments, and the error bar indicates standard error. Different letters above each data point indicate significant differences (P < 0.01; Tukey–Kramer). (C) The wild-type strain harbouring tRNAArgICG-expressing plasmid used in (A) was challenged with serially diluted colicin D, and the viability as well as status of tRNAArgICG were analysed. Cells with the empty plasmid were used as a control (leftmost lane). Error bars shown in the bottom scatter plot indicate standard error of five independent experiments. The asterisk indicates that the signal intensity of intact tRNAArgICG in the lane is almost comparable to that of the control cells with empty plasmid (leftmost lane). Arrowheads observed in (A) and (C) indicate the cleaved 3′-tRNA fragments. 5S labelled in (A) indicates a band of E. coli 5S rRNA detected as a loading control
Figure 5. Involvement of the nicked-tRNAArgICG in translation impairment. (A) Aminoacyl-total tRNA was incubated with or without D-CRD. After the removal of D-CRD by phenol/chloroform treatment, each of these total tRNAs (0.4 μg) was added to in vitro translation system containing a complete set of total tRNA (12 μg). The translation activity was evaluated by the activity of β-galactosidase synthesized in the translation system. Open and solid circles indicate the addition of aminoacyl tRNA treated with or without D-CRD, respectively, and the solid square denotes the addition of tRNA stock buffer instead. Error bars indicate standard error of three independent experiments. (B) Total aminoacyl-tRNA was incubated with D-CRD for the cleavage of tRNAArgICG, which was followed by further incubation with EF-Tu∙GTP or EF-Tu alone. The mixture was electrophoresed in native and denaturing gels, followed by northern blot hybridization with a probe specific for the 3′-fragment of tRNAArgICG to analyse TC formation (upper panel) and tRNA cleavage (lower panel). (C) Total aminoacyl-tRNA was incubated with EF-Tu in the presence or absence of GTP. Subsequently, various amounts of D-CRD were added, followed by further incubation, which was indicated by labelling it as ‘incubation.’ TC formation (upper panel) and the cleavage (lower panel) of tRNAArgICG were analysed as shown in (B). (D) Colicin D-resistant strain harbouring each of the pSTV28-derived plasmids encoding wild-type tRNAArgICG, tRNAArgICG (C32U), or tRNAArgICG (A20U) was challenged with colicin D, and their viabilities (upper histogram) as well as the status of tRNAArgICG (lower panel) were analysed. Empty pSTV28 plasmid was used as a control, which is indicated as ‘none.’ Error bar indicates standard error of seven independent experiments. Statistical significance compared to the control strain (labelled ‘none’) was determined using Student’s t-test. P-values less than 0.01 are represented as **. Closed and open arrows in (B) and (C) indicate tRNAArgICG with or without EF-Tu∙GTP, respectively, while closed arrowheads in (B), (C), and (D) indicate the 3′-fragment of cleaved tRNAArgICG.