1,040
Views
4
CrossRef citations to date
0
Altmetric
Research Paper

Gastrodin promotes CNS myelination via a lncRNA Gm7237/miR-142a/MRF pathway

, , , , , , , , , , , , & ORCID Icon show all
Pages 1279-1290 | Received 24 Apr 2019, Accepted 21 Oct 2020, Published online: 05 Nov 2020

Figures & data

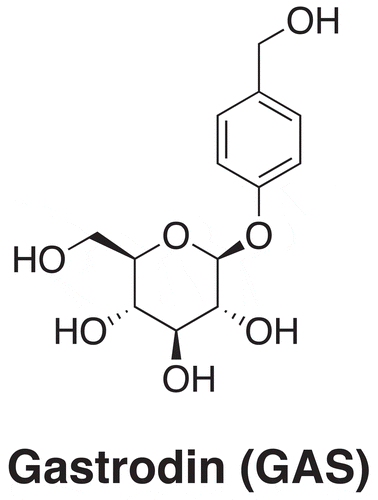
Figure 1. Chemical structure of gastrodin

Figure 1. Chemical structure of gastrodin

Figure 2. GAS promotes CNS myelination. (A, B) (A) Electron microscopy (EM) images of spinal cords isolated from control, demyelination, remyelination and GAS-treatment model mice. Scale bar: 5 µm. (B) Quantification. (C, D) (C) Luxol fast blue (LFB) staining of hippocampus of brain tissues isolated from control, demyelination, remyelination and GAS-treatment model mice. Scale bar: 100 µm. (D) Quantification. (E, F) (E) Western blotting analysis of MBP and MOG in hippocampus of brain tissues isolated from control, demyelination, remyelination and GAS-treatment model mice. (F) Quantification. Scale bar: 100 µm. Data are shown as mean ± SEM (n = 3). *P< 0.05
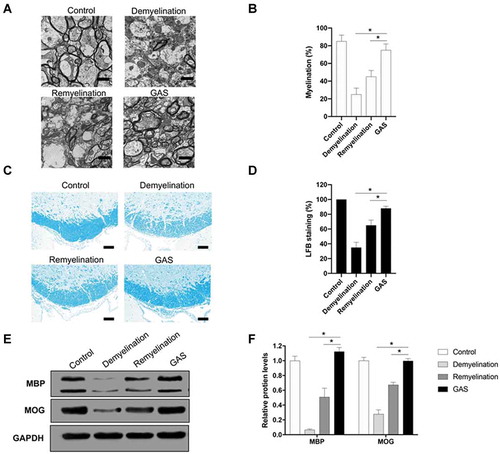
Figure 2. GAS promotes CNS myelination. (A, B) (A) Electron microscopy (EM) images of spinal cords isolated from control, demyelination, remyelination and GAS-treatment model mice. Scale bar: 5 µm. (B) Quantification. (C, D) (C) Luxol fast blue (LFB) staining of hippocampus of brain tissues isolated from control, demyelination, remyelination and GAS-treatment model mice. Scale bar: 100 µm. (D) Quantification. (E, F) (E) Western blotting analysis of MBP and MOG in hippocampus of brain tissues isolated from control, demyelination, remyelination and GAS-treatment model mice. (F) Quantification. Scale bar: 100 µm. Data are shown as mean ± SEM (n = 3). *P< 0.05

Figure 3. LncRNA Gm7237 is up-regulated by GAS. (A) Hierarchical clustering analysis of lncRNAs that were differentially expressed in hippocampus of brain tissues isolated from demyelination and GAS-treatment model mice. (B) RT-qPCR analysis of up-regulated lncRNAs. (C, D) (C) Northern blotting analysis of Gm7237 in hippocampus of brain tissues isolated from control, demyelination, remyelination and GAS-treatment model mice. U6 served as internal control. (D) Quantification. Data are shown as mean ± SEM (n = 3). *P< 0.05
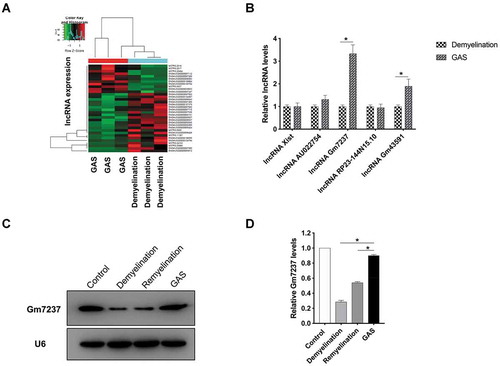
Figure 3. LncRNA Gm7237 is up-regulated by GAS. (A) Hierarchical clustering analysis of lncRNAs that were differentially expressed in hippocampus of brain tissues isolated from demyelination and GAS-treatment model mice. (B) RT-qPCR analysis of up-regulated lncRNAs. (C, D) (C) Northern blotting analysis of Gm7237 in hippocampus of brain tissues isolated from control, demyelination, remyelination and GAS-treatment model mice. U6 served as internal control. (D) Quantification. Data are shown as mean ± SEM (n = 3). *P< 0.05

Figure 4. LncRNA Gm7237 is a positive regulator of CNS myelination. (A) Localization of Gm7237 in OPCs through FISH analysis. Cy3-labelled probes targeting Gm7237 or 18S were used. Hoechst was used to stain nucleus. (B) RT-qPCR analysis of Gm7237 levels in OPCs after transfection with Gm7237 plasmid or Gm7237 siRNA. (C, D) (C) Western blotting analysis of MBP protein levels in OPCs after transfection with Gm7237 plasmid or Gm7237 siRNA. GAPDH served as internal control. (D) Quantification. (E) Immunofluorescence staining of MBP in OPCs after transfection with Gm7237 plasmid or Gm7237 siRNA. DAPI was used to stain nucleus. (F, G) (F) Western blotting analysis of MBP protein levels in OPCs after treatment with GAS, transfection with Gm7237 siRNA, or co-treatment with GAS and Gm7237 siRNA. (G) Quantification. (H) Immunofluorescence staining of MBP in OPCs after treatment with GAS, transfection with Gm7237 siRNA, or co-treatment with GAS and Gm7237 siRNA. DAPI was used to stain nucleus. Scale bar: 20 µm. Data are shown as mean ± SEM (n = 3). *P< 0.05
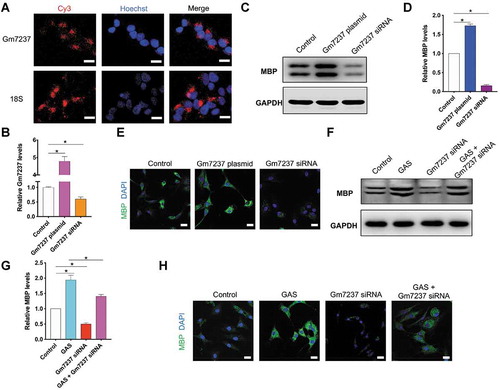
Figure 4. LncRNA Gm7237 is a positive regulator of CNS myelination. (A) Localization of Gm7237 in OPCs through FISH analysis. Cy3-labelled probes targeting Gm7237 or 18S were used. Hoechst was used to stain nucleus. (B) RT-qPCR analysis of Gm7237 levels in OPCs after transfection with Gm7237 plasmid or Gm7237 siRNA. (C, D) (C) Western blotting analysis of MBP protein levels in OPCs after transfection with Gm7237 plasmid or Gm7237 siRNA. GAPDH served as internal control. (D) Quantification. (E) Immunofluorescence staining of MBP in OPCs after transfection with Gm7237 plasmid or Gm7237 siRNA. DAPI was used to stain nucleus. (F, G) (F) Western blotting analysis of MBP protein levels in OPCs after treatment with GAS, transfection with Gm7237 siRNA, or co-treatment with GAS and Gm7237 siRNA. (G) Quantification. (H) Immunofluorescence staining of MBP in OPCs after treatment with GAS, transfection with Gm7237 siRNA, or co-treatment with GAS and Gm7237 siRNA. DAPI was used to stain nucleus. Scale bar: 20 µm. Data are shown as mean ± SEM (n = 3). *P< 0.05

Figure 5. The direct target of Gm7237 is miR-142a. (A) mRNA-ceRNA analysis of Gm7237 targets. (B) Schematic illustration of using biotinylated Gm7237 to pull down miRNA targets for Gm7237. (C) RT-qPCR analysis of miRNA levels in pull-down samples that were cell lysis of OPCs transfected with biotinylated nc probe or biotinylated Gm7237 probe and enriched by streptavidin magnetic beads. (D) RT-qPCR analysis of miR-142a levels in OPCs after transfection with Gm7237 plasmid or Gm7237 siRNA. (E) Design of luciferase reporter gene containing Gm7237 or mutated Gm7237. (F) Relative luciferase signals from OPCs that were transfected with luciferase gene for Gm7237 or mutated Gm7237 and miR-142a or anti-miR-142a. Data are shown as mean ± SEM (n = 3). *P< 0.05
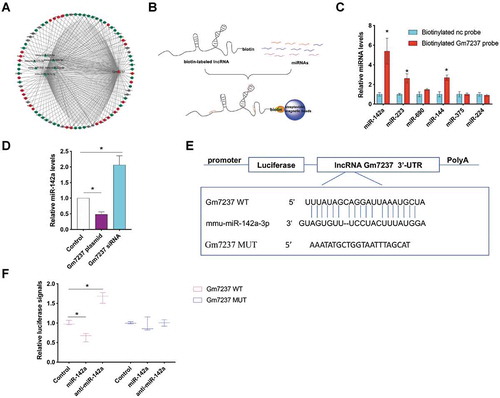
Figure 5. The direct target of Gm7237 is miR-142a. (A) mRNA-ceRNA analysis of Gm7237 targets. (B) Schematic illustration of using biotinylated Gm7237 to pull down miRNA targets for Gm7237. (C) RT-qPCR analysis of miRNA levels in pull-down samples that were cell lysis of OPCs transfected with biotinylated nc probe or biotinylated Gm7237 probe and enriched by streptavidin magnetic beads. (D) RT-qPCR analysis of miR-142a levels in OPCs after transfection with Gm7237 plasmid or Gm7237 siRNA. (E) Design of luciferase reporter gene containing Gm7237 or mutated Gm7237. (F) Relative luciferase signals from OPCs that were transfected with luciferase gene for Gm7237 or mutated Gm7237 and miR-142a or anti-miR-142a. Data are shown as mean ± SEM (n = 3). *P< 0.05

Figure 6. MRF is the direct target of miR-142a. (A) Schematic illustration of immunoprecipitation methods to capture RISC. (B) RT-qPCR analysis of target mRNAs in pull-down samples that were cell lysis of OPCs purified by IgG or AGO2 antibody. (C) Design of luciferase reporter gene containing 3ʹ-UTR of MRF or mutated 3ʹ-UTR of MRF. (D) Relative luciferase signals from OPCs that were transfected with luciferase gene containing 3ʹ-UTR of MRF or mutated 3ʹ-UTR of MRF and miR-142a or anti-miR-142a. (E, F) (E) Western blotting analysis of MRF and MBP protein levels in OPCs that were transfected with miR-142, anti-miR-142a or miR-142a plus MRF plasmid. (F) Quantification. Data are shown as mean ± SEM (n = 3). *P< 0.05
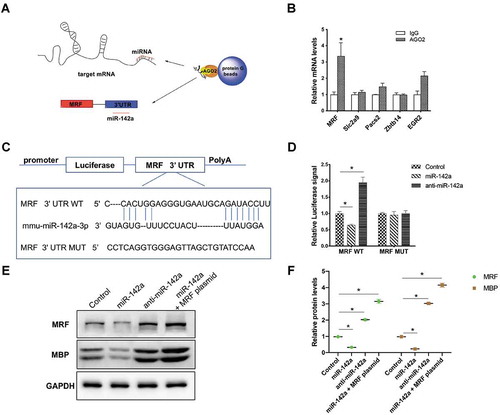
Figure 6. MRF is the direct target of miR-142a. (A) Schematic illustration of immunoprecipitation methods to capture RISC. (B) RT-qPCR analysis of target mRNAs in pull-down samples that were cell lysis of OPCs purified by IgG or AGO2 antibody. (C) Design of luciferase reporter gene containing 3ʹ-UTR of MRF or mutated 3ʹ-UTR of MRF. (D) Relative luciferase signals from OPCs that were transfected with luciferase gene containing 3ʹ-UTR of MRF or mutated 3ʹ-UTR of MRF and miR-142a or anti-miR-142a. (E, F) (E) Western blotting analysis of MRF and MBP protein levels in OPCs that were transfected with miR-142, anti-miR-142a or miR-142a plus MRF plasmid. (F) Quantification. Data are shown as mean ± SEM (n = 3). *P< 0.05

Figure 7. GAS promotes CNS myelination via the Gm7237/miR-142a/MRF pathway. (A, B) RT-qPCR analysis of (A) miR-142a and (B) MRF levels in hippocampus of brain tissues isolated from control, demyelination, remyelination and GAS-treatment model mice. (C, D) Western blotting analysis of MRF and MBP protein levels in OPCs that were treated with GAS, or transfected with Gm7237 plasmid, or co-treated with Gm7237 plasmid plus miR-142a, or co-treated with GAS plus miR-142a, or co-treated with GAS plus Gm7237 plasmid plus miR-142a. (D) Quantification. (E) Immunostaining of MBP in OPCs that were treated with GAS, or transfected with Gm7237 plasmid, or co-treated with Gm7237 plasmid plus miR-142a, or co-treated with GAS plus miR-142a, or co-treated with GAS plus Gm7237 plasmid plus miR-142a. DAPI was used to stain nucleus. Scale bar: 20 µm. Data are shown as mean ± SEM (n = 3). *P< 0.05
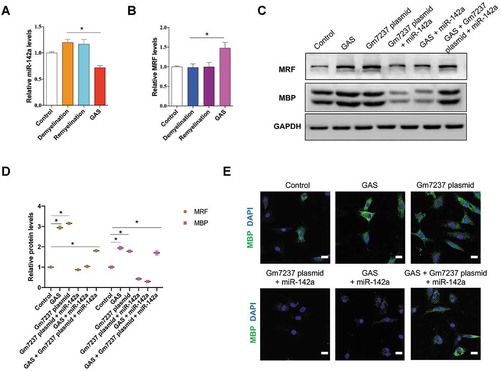
Figure 7. GAS promotes CNS myelination via the Gm7237/miR-142a/MRF pathway. (A, B) RT-qPCR analysis of (A) miR-142a and (B) MRF levels in hippocampus of brain tissues isolated from control, demyelination, remyelination and GAS-treatment model mice. (C, D) Western blotting analysis of MRF and MBP protein levels in OPCs that were treated with GAS, or transfected with Gm7237 plasmid, or co-treated with Gm7237 plasmid plus miR-142a, or co-treated with GAS plus miR-142a, or co-treated with GAS plus Gm7237 plasmid plus miR-142a. (D) Quantification. (E) Immunostaining of MBP in OPCs that were treated with GAS, or transfected with Gm7237 plasmid, or co-treated with Gm7237 plasmid plus miR-142a, or co-treated with GAS plus miR-142a, or co-treated with GAS plus Gm7237 plasmid plus miR-142a. DAPI was used to stain nucleus. Scale bar: 20 µm. Data are shown as mean ± SEM (n = 3). *P< 0.05

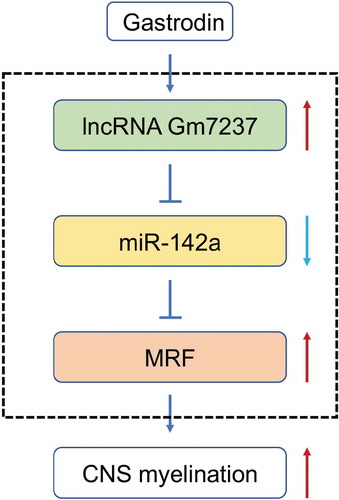
Figure 8. A schematic diagram of GAS-promoted CNS myelination. GAS upregulates the lncRNA Gm7237, which directly regulates miR-142/MRF pathway

Figure 8. A schematic diagram of GAS-promoted CNS myelination. GAS upregulates the lncRNA Gm7237, which directly regulates miR-142/MRF pathway
Supplemental material

Supplemental Material

Download Zip (4.5 MB)

Reprints and Corporate Permissions

Please note: Selecting permissions does not provide access to the full text of the article, please see our help page How do I view content?

To request a reprint or corporate permissions for this article, please click on the relevant link below:

Academic Permissions

Please note: Selecting permissions does not provide access to the full text of the article, please see our help page How do I view content?

Obtain permissions instantly via Rightslink by clicking on the button below:

If you are unable to obtain permissions via Rightslink, please complete and submit this Permissions form. For more information, please visit our Permissions help page.