
Figures & data
Figure 1. The patients and rats with RA show higher expression of lncRNA NEAT1. (A) LncRNA NEAT1 expression in RA and normal synovial tissues determined by RT-qPCR. (B) Joints of RA and normal rats and paw thickness of normal and RA rats. (C) HE staining images of synovial tissues of normal and RA rats and arthritis score of normal and RA rats (× 400). (D) ELISA to analyse the levels of inflammatory factors in normal and RA rats. (E) RT-qPCR to determine the expression of lncRNA NEAT1 in normal and RA rats. * p < 0.05 vs. the normal rats. The data were expressed as mean ± standard deviation and analysed using unpaired t-test and repeated measures analysis of variance. The experiment was repeated three times independently
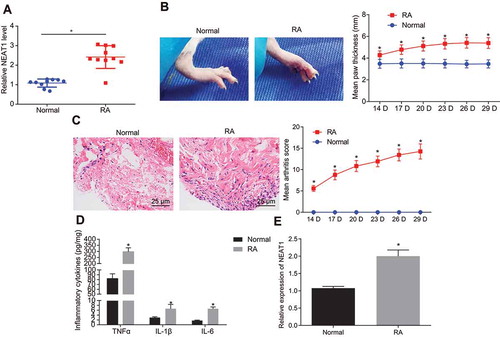
Figure 2. Synovial cell proliferation and synovitis are inhibited upon silencing lncRNA NEAT1 in RA. (A) RT-qPCR analysis of lncRNA NEAT1 expression in FLSs treated with si-NC and si-NEAT1. (B) Paw thickness of rats treated with si-NC and si-NEAT1. (C) HE staining of arthritis score of rats treated with si-NC and si-NEAT1. (D) ELISA to analyse TNF-α, IL-1β and IL-6 levels in FLSs of rats treated with si-NC and si-NEAT1. (E) FLS proliferation in rats treated with si-NC and si-NEAT1 determined by EdU assay. H, The proportion of EdU-positive cells. * p < 0.05 vs. the si-NC treatment. The data were expressed as mean ± standard deviation and analysed using unpaired t-test and repeated measures analysis of variance. The experiment was repeated three times independently
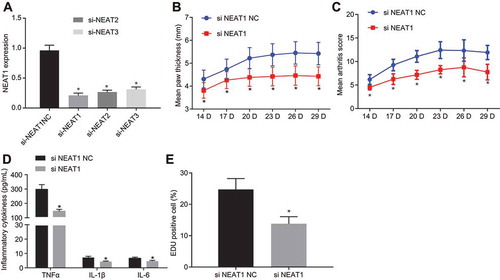
Figure 3. Inhibition of lncRNA NEAT1 suppresses FLS proliferation and synovitis through inactivation of the MAPK/ERK signalling pathway. (A) RT-qPCR analysis of ERK1/2 expression in synovial tissues of normal control subjects and patients with RA. (B) Western blot analysis of ERK1/2 and P38 MAPK expression and phosphorylation level of ERK1/2 and P38 MAPK normalized to GAPDH in synovial tissues of normal control subjects and patients with RA. * p < 0.05 vs. normal synovial tissues. (C) ELISA assays for TNF-α, IL-1β and IL-6 levels in FLS upon lncRNA NEAT1 overexpression and MAPK/ERK inhibition. (D) FLS proliferation upon lncRNA NEAT1 overexpression and MAPK/ERK inhibition determined by EdU assay. (E) RT-qPCR determination of lncRNA NEAT1 and ERK1/2 expression after lncRNA NEAT1 overexpression and MAPK/ERK inhibition in FLSs. (F) Western blot analysis of ERK1/2 and P38 MAPK expression and extent of ERK1/2 and P38 MAPK phosphorylation normalized to GAPDH in FLSs after lncRNA NEAT1 overexpression and MAPK/ERK inhibition. * p < 0.05 vs. the oe-NC treatment; # p < 0.05 vs. the DMSO treatment, @ p < 0.05 vs. the phosphorylated ERK1/2 inhibitor, & p < 0.05 vs. the phosphorylated P38 inhibitor. The data were expressed as mean ± standard deviation and analysed using one-way analysis of variance. The experiment was repeated three times independently
Figure 4. LncRNA NEAT1 inhibits the expression of miR-129 and miR-204 to activate the MAPK/ERK signalling pathway. (A) Binding sites between miR-129 and MAPK1 and mutated site sequences of MAPK1 3ʹ-UTR. (B) Binding sites between miR-204 and MAPK1 and mutated site sequences of MAPK1 3ʹ-UTR. (C) Targeting relationship between miR-129 and MAPK1 detected by dual luciferase reporter gene assay. (D) Targeting relationship between miR-204 and MAPK1 luciferase activity detected by dual luciferase reporter gene assay. * p < 0.05 vs. the NC treatment. (E) RIP assay to detect the binding of lncRNA NEAT1 to miR-204 and miR-129, * p < 0.05 vs. IgG. (F) The expression of miR-129 and miR-204 in synovial tissues of normal control subjects and patients with RA determined by RT-qPCR. (G) The expression of miR-129 and miR-204 in FLSs after overexpressing lncRNA NEAT1 determined by RT-qPCR. * p < 0.05 vs. FLSs treated with oe-NC. (H) ELISA to analyse TNF-α, IL-1β and IL-6 levels in FLSs after inhibition of miR-129 or miR-204. * p < 0.05 vs. FLSs treated with inhibitor NC, # p < 0.05 vs. FLSs treated with si-NEAT1 + inhibitor NC. (I) FLS proliferation upon inhibition of miR-129 or miR-204 detected by EdU assay. * p < 0.05 vs. FLSs treated with inhibitor NC, # p < 0.05 vs. FLSs treated with si-NEAT1 + inhibitor NC. (J) Western blot analysis of ERK1/2 and P38 MAPK expression and the extent of ERK1/2 and P38 MAPK phosphorylation normalized to GAPDH in FLSs upon inhibition of miR-129 or miR-204. * p < 0.05 vs. FLSs treated with inhibitor NC, # p < 0.05 vs. FLSs treated with si-NEAT1 + inhibitor NC. (K) Prediction of the enrichment of CpG islands in the promoter of miR-129 by MethPrimer. (L) The methylation level of the promoter of miR-129 determined by MSP. (M) The methylation level of the promoter of miR-129 determined by BSP. (N) The expression of miR-129 in FLSs upon silencing lncRNA NEAT1 determined by RT-qPCR. * p < 0.05 vs. FLS treated with si-NEAT1. (O) Correlation analysis of lncRNA NEAT1 and miR-129. (P) Correlation analysis of lncRNA NEAT1 and miR-204. The data were expressed as mean ± standard deviation and analysed using unpaired t-test. Comparison between multiple groups was made by one-way analysis of variance, and Pearson’s correlation analysis was applied to determine strength of correlation. The experiment was repeated three times independently
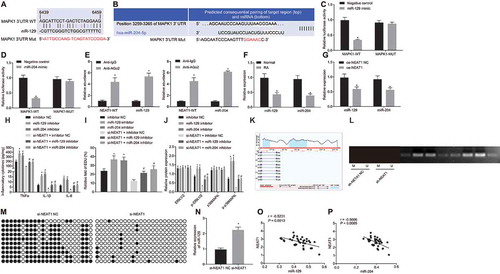
Figure 5. Silencing lncRNA NEAT1 suppresses the expression of miR-129 and miR-204 to inhibit FLS proliferation and synovitis in RA rats. (A) The thickness of rat paws upon inhibition of miR-129 or miR-204. (B) Arthritis score of rats upon inhibition of miR-129 or miR-204. (C) Western blot analysis of ERK1/2 and P38 MAPK expression and the extent of ERK1/2 and P38 MAPK phosphorylation normalized to GAPDH in synovial tissues upon inhibition of miR-129 or miR-204 and overexpression of LncRNA NEAT1. * p < 0.05 vs. rats treated with inhibitor NC. The data were expressed as mean ± standard deviation and analysed using one-way analysis of variance and repeated measures analysis of variance. The experiment was repeated three times independently
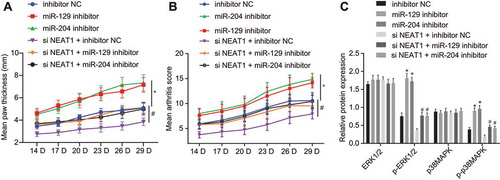
Table 1. Primer sequences for RT-qPCR
Table 2. Primer sequences for MSP