Figures & data
Figure 1. MINC and SSD regulate transcription initiation at different locations. A. Bar graph of unique mapped reads, TSS and TSS clusters in WT_SSD, ssdΔ, WT_MINC and Mot1&Ino80AA. B. Genome-wide distribution of novel TSSs in the Mot1&Ino80AA in promoter and coding regions. C. Genome-wide distribution of novel TSSs in ssdΔ at the promoter and coding region. D. Metagene profiles of the relative change of TSS in mutants compared to WT
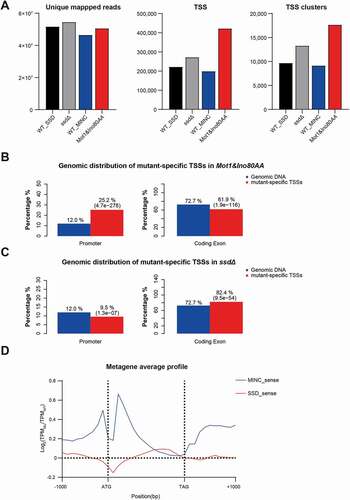
Figure 2. Impact of the Mot1&Ino80AA mutant on core promoter shape. A. PSS frequency in WT and the Mot1&Ino80AA mutant (left) or WT and the ssdΔ mutant (middle panel). Visualization of CAGE signals in the promoter region of YIR012W by Genome Browser is shown in the right panel. B,D,F. PSS frequency in WT and the Mot1&Ino80AA mutant on single/multiple (B) and TATA and TATA-less (D) clusters. C, E. Violin plot of PSS distribution in WT and the Mot1&Ino80AA mutant on single/multiple (C) and TATA and TATA-less (E) clusters. The p-value more than 1e-50, between 1e-50 and 1e-100, lower than 1e-100 are inidcated as *, ** and ***, respectively
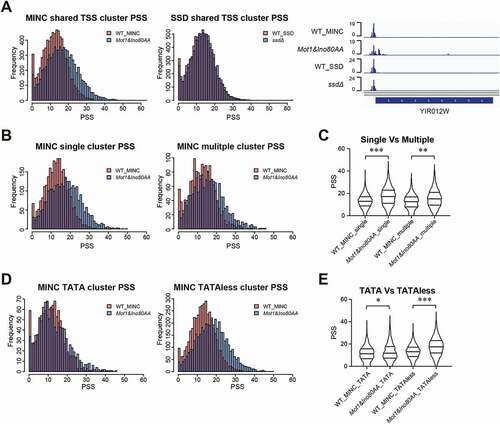
Figure 3. MINC regulates transcription initiation differently in TATA containing and TATA-less promoters. A. The relative change of TCs transcription around the TSS in the MINC and ssdΔ mutant versus WT. B. Heatmap of the relative changes of TCs transcription in the MINC mutant versus WT around the TSS on TATA/TATA-less, OPN/DPN, and essential/non-essential group. C. Visualization of CAGE signals in the promoter region of YAL060W (TATA) by Genome Browser. D. Same as C except for gene YAL058W (TATA-less). E. Average profiles of the relative change on TSS activities in the MINC mutant versus WT around the TSS. Genes were divided into TATA and TATA-less groups. F. Same as E except for OPN and DPN groups. G. Same as E except for essential and non-essential groups. H. Average profiles of the relative nucleosome change on TCs around Dyad in TATA and TATA-less group. I. Same as H except for OPN and DPN groups. J. Same as H except for essential and non-essential groups
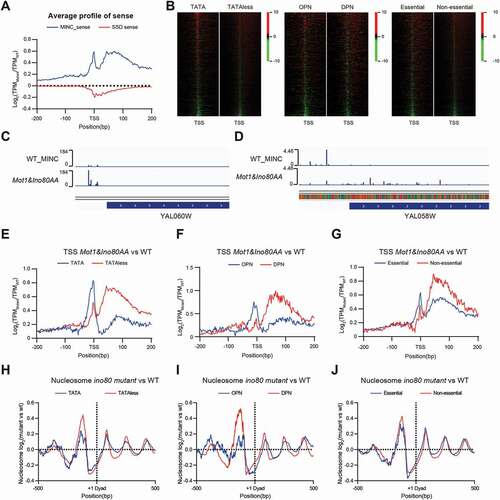
Figure 4. MINC regulate upstream antisense transcription initiation. A. The relative change of antisense transcription initiation around the TSS in the MINC and ssdΔ mutants versus WT. B. Average profiles of the relative change on antisense transcription initiation in the MINC mutant versus WT around the TSS in TATA-containing and TATA-less groups. C. Same as B except in OPN and DPN groups. D. Same as B except in essential and non-essential groups. E. Same as B except in divergent promoters and all genes. F. Same as B except in divergent promoters with TSS distance more than 300 bp and all genes. G. Heatmap of relative changes of transcription initiation in the MINC mutant versus WT around the TSS on divergent promoters. The gene pairs with divergent promoters were sorted by the distance between the two TSS and illustrated at the left panel. Heatmap of relative changes of transcription initiation with different directions are shown in the middle panel, and the transcription direction is labelled on the bottom. The relative change of gene expression on the left of the right genes is shown in the right panel. H. Genome Browser example of both upregulated TCs on a divergent promoter
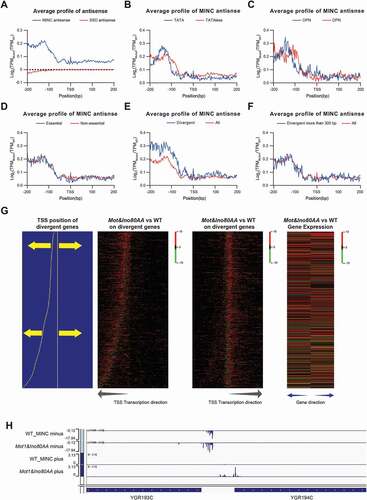
Figure 5. The correlation between transcription level and promoter shape is different in TATA and TATA-less promoters. A. The scatter plot showing the correlation between PSS and TPM in WT and MINC mutant. B. The scatter plot showing the correlation between the changes of PSS/width(left/right) and TPM in the MINC mutant versus WT. C. The scatter plot showing the correlation between the changes of PSS and TPM in MINC mutant versus WT separated by the TPM level in WT. D. The scatter plot showing a correlation between PSS and TPM in WT and MINC mutant of TATA. E. The scatter plot showing the correlation between the changes of PSS and TPM in the MINC mutant versus WT at TATA group. F. Same as D except in TATA-less group. G. Same as E except in TATAless group. Datas used in these scatter plots were transformed by moving average, which is descripted in the data analysis method