Figures & data
Table 1. Library stats and sequence diversity
Figure 1. The principle steps of 5′XP sRNA-seq. Small-RNA sequencing using 5′XP sRNA-seq generates two sub-libraries, either sensitive (5P-tag) or insensitive (5X-notag) to a phosphate (P) in the 5′-terminal of the original RNA. This is done by tagging RNA fragments with 5′-P using a sequence-specific oligo that identifies the 5′-P in the downstream bioinformatic analysis
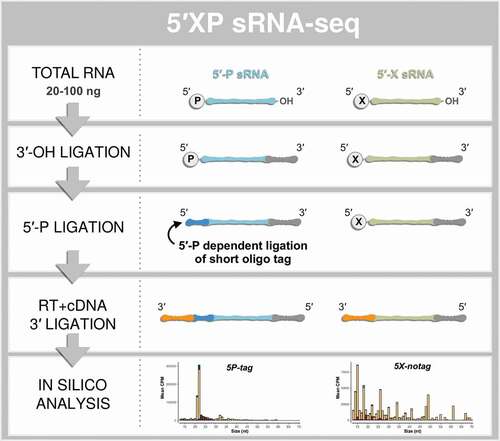
Figure 2. 5X-seq catches different small RNAs compared to 5P-seq. In order to generate a sequencing method more inclusive of RNAs with 5′ modifications we compared two adapter ligation strategies: 5P-seq adds the 5′ adapter on RNA and is dependent on 5′ phosphorylation, and 5X-seq adds the 5′ adapter, to the corresponding 3′ side of cDNA and is therefore independent of 5′ RNA phosphorylation. Stacked bars showing the sRNA composition of 5P and 5X libraries, allowing for (A) no mismatches and (C) 3 mismatches in the annotation against sRNA reference sequences. Batch A and B indicates samples isolated from the two independent pools of RNA. Violin plots with log2 fold differences between 5X and 5P per unique sequence when (B) 0 mismatches and (D) 3 mismatches are allowed. Pie charts show per cent up- and down-regulated sequences. Only unique sequences that passed 10 CPM in all samples of a method (either 5P or 5X) was included. mt = mitochondrial. CPM = counts per million reads
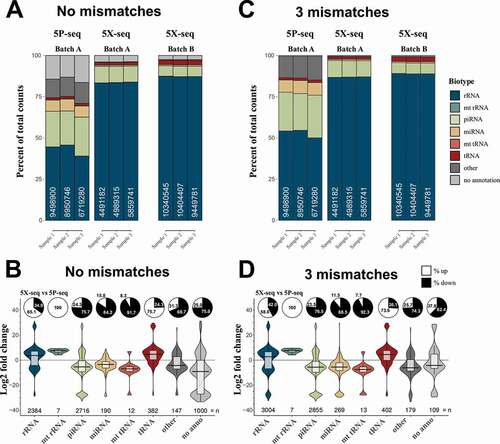
Figure 3. 5XP-seq replicates 5X-seq and identifies 5′ phosphorylated sRNA species. 5XP-seq distinguishes sRNA with (5P-tag) and without (5X-notag) 5′-terminal phosphorylation which characterize canonical miRNA and piRNA. (A) Correlation plot ordered by unsupervised hierarchical clustering showing three separate clusters, where all 5X-type libraries (5X-seq; 5X-notag sub-libraries of 5XP-seq) generates similar sequencing libraries, while 5P-seq and the 5P-tag sub-libraries of 5XP-seq forms two separate clades. (B) Histograms showing the mean expression of biotypes across different fragment sizes. (C) Size distributions of known miRNA and piRNA (left panels) show that the 5P-tag sub-libraries of 5XP-seq generates a cleaner canonical piRNA peak in the expected size range, with a typical Uridine (U) bias on the 1st nucleotide (middle panels), than 5P-seq. Size distribution and 1st nucleotide bias of miRNA are more similar between libraries (right panel). (D) Correlation plot ordered by hierarchical clustering of only annotated miRNA confirms that 5P-seq and 5P-tag sub-libraries enrich the same miRNA. Analysis was performed on sRNA that reached 10 CPM in all replicates of a method. Yellow and green boxes in the correlation plots shows libraries generated from two separate pools of RNA from drosophila embryos. CPM = counts per million reads
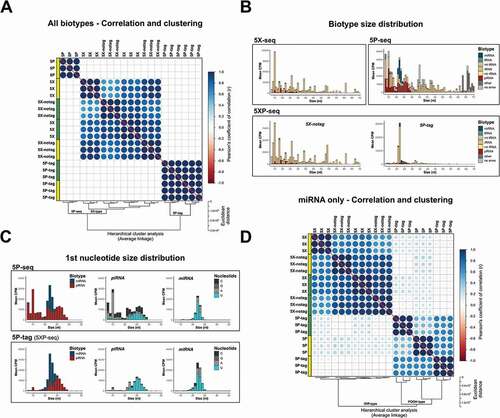
Figure 4. 5P-type libraries enrich 5´ rRNA fragments while 5X-type libraries enrich 3´ fragments. Graphs shows 5´ and 3´ stratification in sRNA derived from rRNA (rRF). (A-B) Coverage plots of rRFs across an example pre-rRNA sequence (45S; green) located on the repetitive rDNA loci (chrUn_CP007120v1), annotated with mature rRNA subunits 18S (light brown), 5.8 (light blue), 2S (light red) and 28S (light turquoise). (A) Shows mean CPM coverage of 5XP-seq libraries separated by 5P-tag (left panel) and 5X-notag (right panel) sub-libraries. (B) Instead shows 5P-seq and 5X-seq control libraries. (C-E) Zoomed-in coverage plots of the 18S, 5.8S and 28S subunits. For 5P-type libraries, roman numbers indicate major peaks present in both regular 5P-seq libraries and the 5P-tag sub-libraries of 5XP-seq. (F) Bars show 5´-rRF enrichment in 5P-type libraries (upper panel) and 3´-rRF enrichment in 5X-type libraries (lower panel). CPM = counts per million reads
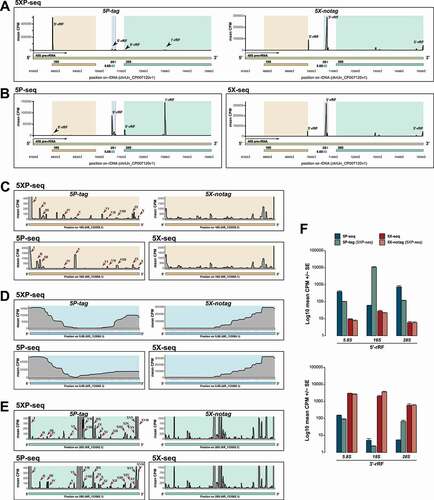
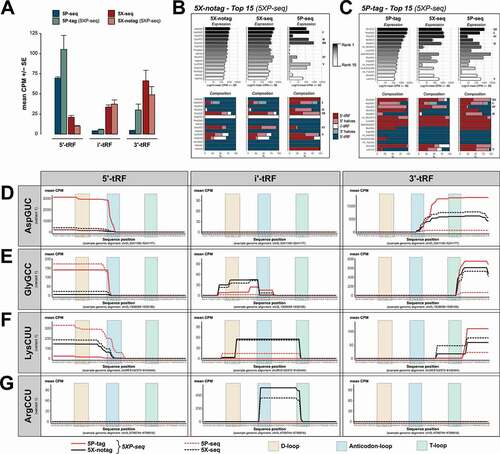
Figure 5. tRNA isodecoder analysis reveals the sRNA complexity generated by different library preparation strategies. Graphs show tRNA-derived sRNA (tRFs) grouped by their classification into 5´, i’ and 3´ sub-species, and tRNA isodecoder family. (A) Bars show 5´-tRF enrichment in 5P-type libraries and 3´-tRF enrichment in 5X-type libraries. (B) Top 15 expressed isodecoders in 5X-notag and their corresponding expression levels (black-grey-white bars) and 5´/i´/3´ ratios (blue/light blue stacked bars) in regular 5X-seq and 5P-seq libraries. (C) Same as (B), but the top expressed isodecoders in 5P-tag sub-libraries. (D-G) Show tRF coverage plots of a selection of isodecoders, separated by 5´, i’ and 3´ tRF classification (left, middle and right panels, respectively). (D) AspGCU, illustrating anticodon-loop cleavage with both 5´ and 3´ halves. (E) GlyGCC, illustrating a 5´ half tRF cleaved in the anticodon-loop and a short 3´ tRF cleaved in the T-loop. (F) LysCUU, illustrating many 5´- and 3´-tRFs, but also an i’-tRF resulting from D- and T-loop cleavage. (G) ArgCCU showing a i’-tRF cleaved between the anticodon- and T-loops. CPM = counts per million reads