Figures & data
Figure 1. Overview of miRNA/siRNA gene silencing pathways in D. melanogaster. The sncRNAs can be categorized in three groups, according to their size and the processing pathway they participate. The miRNAs (22 nucleotides) and siRNAs (21 nucleotides) follow independently processing pathway for gene silencing by translational repression or mRNA degradation. The miRNA biogenesis starts with the transcription of a primary transcript (pri-miRNA) with some structural peculiarities (hairpin loop domains, 5ʹ cap and poly-A tail) (step 1). Intragenic regions can generate miRNAs; the loop present on spliceosome is recognized and processed by DBR1 (step 2), generating a pre-miRNA. The pri-miRNA loops are recognized by the DROSHA-PASHA complex associated with ARS2, CBC and SMD1, essential proteins in complex recruitment and pri-miRNA structural elements recognition (step 3). The pri-miRNA is cleaved by DROSHA (step 4) and the pre-miRNA exported to the cytoplasm by RANBP21 (step 5). In cytoplasm, the pre-miRNA is processed by DCR1 (step 6) in association with LOQS-PB and its loop is removed, generating a double-strand miRNA which is loaded on AGO1 (step 7), where one strand of miRNA duplex is selected as mature miRNA (step 8) and will constitute a mature RISC complex (step 9), which attaches to target mRNA directed by miRNA-mRNA base pairing, culminating in mRNA degradation (step 10) or translational repression (step 11). Unlike miRNA pathway, who biogenesis follows an endogenous-starting pathway, the siRNA starts, mainly, from an exogenous dsRNA source (as virus or some artificial source) or an endogenous-alternative source of dsRNA incorporated on host cell genome (steps 12, 13 and 14). According to the origin of dsRNA, it follows different, but remarkably similar, processing-pathways. The long exogenous dsRNA (exo-siRNA) is recognized by R2D2-DCR2 complex (step 15) and endo-siRNA is recognized by a complex of R2D2, DCR2 and LOQS-PD in association (step 16). Both siRNAs are cleaved by DCR2 stimulated by ARS2 and SMD1 (step 17) and associated with AGO2 (step 18). The selection of the guide-strand of mature siRNA is optimized by the association of AGO2 with the C3PO complex and its stabilization is acquired by siRNA methylation by HEN1 (step 19) until the mRNA target attachment. The mature RISC complex formation is dependent of the association of many proteins which enhance mRNA recognition and structure-changing, such as RHEL, SMD1, TSN and FMR1 (step 20). Once mRNA is attached to the mature RISC complex (step 21), the gene silencing is reached by mRNA degradation (step 22)
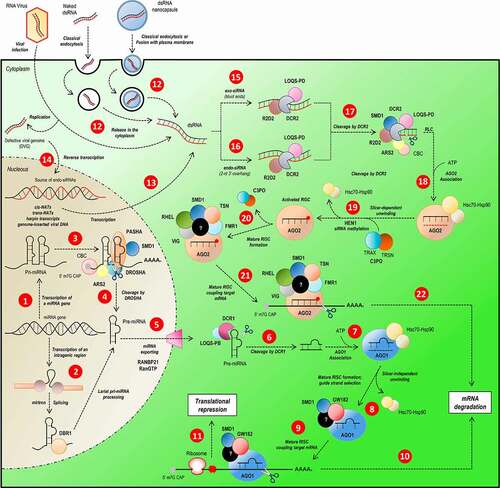
Figure 2. Phylogenetic analysis of the main RNAi machinery core elements in five different insect orders. (A-D) phylogenetic trees (Maximum Likelihood) showing the relationship among complete proteins from the basic core of miRNAs and siRNAs pathways in five insect orders (Coleoptera, Diptera, Hemiptera, Hymenoptera and Lepidoptera, represented by coloured triangles – full lines). (A) AGO proteins; (B) RNAse III proteins (DCR1-2 and DROSHA); (C) DCR partners (LOQS and R2D2; dsrm-containing proteins); and (D) PASHA. The grey square on each phylogenetic tree represents the selected outgroup: (A) Exiguobacterium sp. ACQ71053.1 (bacteria); (B) Batrachochytrium dendrobatidis XP_006676691.1 (fungi); (C) Homo sapiens NP_599150.1 (TARBP2); and (D) Rhodamnia argentea XP_030526936.1 (plant). The cut-off value for bootstrap was 70 (represented by dark blue circles). The big blue square (dashed line) on the top represents the evolutionary relationship expected for each Metazoa phylum presented on the analysis. The dashed triangles represent the outgroup phyla (purple – Chordata; orange – Cnidaria; green – Nematoda; and red – Platyhelminthes). All phylogenetic tree files (.tre) can be found in Supplementary Section, as well as the selected species and the respective protein IDs (see Tables S1 and S2)
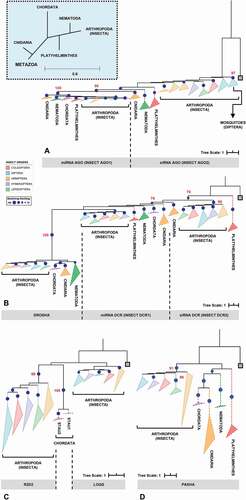
Figure 3. Evolutionary rate evaluation of the main RNAi machinery core elements in five different insect orders. The graph shows the distribution of the evolutionary rate (K value) in each alignment position for all protein classes analysed. Box plot interpretation: The line in the middle of the box represents the median (mid-point of the data). Each part of the box divided by the median line represents 25% of the data distribution. In this way, the box represents 50% of the data. The unfiled small square inside the boxes represents the average value. The whiskers (upper and lower) represent scores outside of the 50% represented by the box. The region delimited by each whisker until the limit of the box represents respectively 25% (lower whisker) and 95% (upper whisker) of the data. The dashes (-) at the ends represent the maximum and minimum values. The ‘exes’ (x) represent outliers. The number of asterisks (*) indicates a statistically significant difference according to the non-parametric median test among insect orders (* p ≤ 0.05; ** p ≤ 0.01; *** p ≤ 0.001)
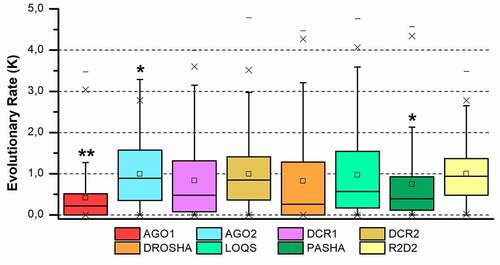
Figure 4. Protein domains from RNAi core proteins. (A) In-scale diagram of protein domains identified in silico in the classes of analysed proteins. (B-I) Distribution of the evolutionary rate (K value) of each identified domain for all protein: (B) AGO1; (C) AGO2; (D) R2D2; (E) DCR1; (F) DCR2; (G) DROSHA; (H) LOQS and (I) PASHA. Asterisks (*) show statistical analysis of the data distribution of each domain compared to the complete protein (grey boxes). The number of asterisks (*) indicates statistically significant difference according to the non-parametric median test among insect orders (* p ≤ 0.05; ** p ≤ 0.01; *** p ≤ 0.001). Box plot interpretation: The line in the middle of the box represents the median (mid-point of the data). Each part of the box divided by the median line represents 25% of the data distribution. In this way, the box represents 50% of the data. The unfiled small square inside the boxes represents the average value. The whiskers (upper and lower) represents scores outside of the 50% represented by the box. The region delimited by each whisker until the limit of the box represents respectively 25% (lower whisker) and 95% (upper whisker) of the data. The dashes (-) at the ends represent the maximum and minimum values. The ‘exes’ (x) represent outliers
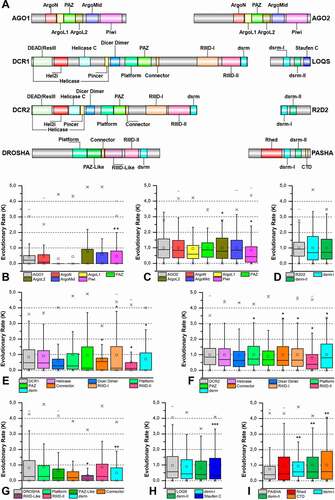
Figure 5. Structural and phylogenetic analysis of dsrm domains. (A) Maximum likelihood analysis including all domains with similar structure to dsrm present in the proteins DCR1, DCR2, DROSHA, LOQS, PASHA and R2D2 from species belonging to the five insect orders (Coleoptera, Diptera, Hemiptera, Hymenoptera and Lepidoptera). Dicer Dimer and Staufen C domains were inserted on this analysis due to have high structural similarity with dsrm. Each triangle represents an insect order, according to the colour legend presented, and it is proportional to the number of branches present. The outgroup (hidden) used was the dsrm domain from human DROSHA (PDB ID: 5B16) and the bootstrap values are represented by dark blue circles (minimum 70). (B) Structural model of dsrm domain from human DROSHA (PDB ID: 5B16, B), interacting with RNA molecule, and (C) the same domain from human DROSHA superimposed with a Dicer Dimer from Arabidopsis thaliana DCL protein (PDB ID: 2KOU), highlighting the differences and similarities between these two domains. (D and E) Superposition of the models from LOQS dsrm-II and DCR2 Dicer Dimer domains, representing dsrm domains that hypothetically can interact preferentially with dsRNAs and proteins, respectively. In (D), the species that represented each insect order were: Coleoptera: T. castaneum (TC011666); Diptera: D. melanogaster (FBpp0080075); Hemiptera: B. tabaci (Bta01704); Hymenoptera: A. melífera (GB47214); and Lepidoptera: M. sexta (Msex2.00134). In (E), the species that represented each insect order were: Coleoptera: T. castaneum (TC001108); Diptera: D. melanogaster (FBpp0086061); Hemiptera: B. tabaci (Bta10685); Hymenoptera: A. melífera (GB48923); and Lepidoptera: M. sexta (Msex2.04462). In both (D) and (E) were highlighted the main variability spots
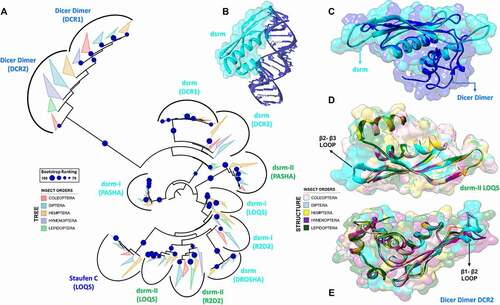
Figure 6. RNA recognition by dsrm and dsrm-like domains. (A) Canonical dsrm domains bind to one major groove and its two adjacent minor grooves by means of the β1-β2 hairpin and the N-terminal regions of helices α1 and α2. (B) The dsrm fold may present high or low affinity for dsRNA, depending on whether the conserved histidine and positively charged residues are present in the β1-β2 loop and α2 helix, respectively. Furthermore, protein-binding dsrms and dsRNA-binding dsrms display contrasting patterns of sequence conservation (see Figures S8 and S13 for complete alignment). (C) The α1-β1 loop of the Dicer Dimer domain from human Dicer (PDB ID: 5ZAK) forms two well-structured grooves which are separated by three proline residues; these proline residues are conserved in insect Dicer proteins. (D) Proposed model for the interaction of Dicer Dimer domains and ssRNA molecules. While the function of the two Dicer Dimer grooves are unknown, they present a positive electrostatic potential and are distanced such that two adjacent phosphate groups of a ssRNA backbone can be modelled to fit them (RNA template was retrieved from PDB ID: 4A36). This model was proposed to account for the Dicer Dimer’s ability to bind single-stranded nucleic acids and promote base-pairing between complementary RNA/DNA molecules in vitro [Citation104]
![Figure 6. RNA recognition by dsrm and dsrm-like domains. (A) Canonical dsrm domains bind to one major groove and its two adjacent minor grooves by means of the β1-β2 hairpin and the N-terminal regions of helices α1 and α2. (B) The dsrm fold may present high or low affinity for dsRNA, depending on whether the conserved histidine and positively charged residues are present in the β1-β2 loop and α2 helix, respectively. Furthermore, protein-binding dsrms and dsRNA-binding dsrms display contrasting patterns of sequence conservation (see Figures S8 and S13 for complete alignment). (C) The α1-β1 loop of the Dicer Dimer domain from human Dicer (PDB ID: 5ZAK) forms two well-structured grooves which are separated by three proline residues; these proline residues are conserved in insect Dicer proteins. (D) Proposed model for the interaction of Dicer Dimer domains and ssRNA molecules. While the function of the two Dicer Dimer grooves are unknown, they present a positive electrostatic potential and are distanced such that two adjacent phosphate groups of a ssRNA backbone can be modelled to fit them (RNA template was retrieved from PDB ID: 4A36). This model was proposed to account for the Dicer Dimer’s ability to bind single-stranded nucleic acids and promote base-pairing between complementary RNA/DNA molecules in vitro [Citation104]](/cms/asset/8e4a755e-3259-4fd1-9795-9b8d2cf65c70/krnb_a_1861816_f0006_oc.jpg)
Figure 7. Structural and phylogenetic analysis of PAZ and Platform domains. (A and B) Maximum likelihood analysis of the PAZ domain presents in the proteins AGO1, AGO2, DCR1, DCR2 and DROSHA (PAZ-like) (A) and Platform (B) domain presents in the proteins DCR1, DCR2 and DROSHA, both from species belonging to the five insect orders (Coleoptera, Diptera, Hemiptera, Hymenoptera and Lepidoptera). Each triangle represents an insect order, according to the colour legend presented, and it is proportional to the number of branches present. The outgroup (hidden) used to the PAZ domain tree was human DCR1 (PDB ID: 4NGD) and the Platform tree was human DROSHA (PDB ID: 5B16). The bootstrap values are represented by dark blue circles (minimum 70). (B-F) Superposition of the models from AGO and DCR PAZ domains, highlighting the main variability spots. No model was found for modelling the PAZ-like domain from DROSHA proteins. In (B), the species that represented each insect order were: Coleoptera: T. castaneum (TC005857); Diptera: D. melanogaster (FBpp0294043); Hemiptera: B. tabaci (Bta01840); Hymenoptera: A. melífera (GB48208); and Lepidoptera: M. sexta (Msex2.06997). In (C), the species that represented each insect order were: Coleoptera: T. castaneum (TC011525); Diptera: D. melanogaster (FBpp0075312); Hemiptera: B. tabaci (Bta00938); Hymenoptera: A. melífera (GB50955); and Lepidoptera: M. sexta (Msex2.05578). In (D), the species that represented each insect order were: Coleoptera: T. castaneum (TC001750); Diptera: D. melanogaster (FBpp0083717); Hemiptera: B. tabaci (Bta12886); Hymenoptera: A. melífera (GB44595); and Lepidoptera: M. sexta (Msex2.10734). In (E), the species that represented each insect order were: Coleoptera: T. castaneum (TC001108); Diptera: D. melanogaster (FBpp0086061); Hemiptera: B. tabaci (Bta10685); Hymenoptera: A. melífera (GB48923); and Lepidoptera: M. sexta (Msex2.04462). (F) Illustrative representation of Platform-PAZ-Connector domains from human DCR 5ZAK PDB model
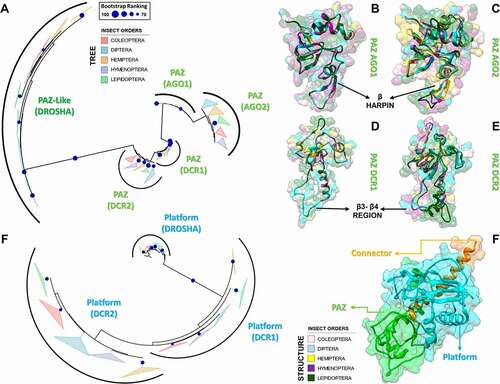
Figure 8. Variabilities within the PAZ and Platform domains. (A) Model for 5ʹ-phosphate recognition in the DCR2 PAZ domain of D. melanogaster. Three residues were mutated in the template structure (PDB ID: 4NH6) to simulate the Drosophila PAZ domain’s ability to recognize 5ʹ-phosphate in vitro in DCR2. Drosophila species lack W1013 in DCR2; we speculate that substituting H982 for either Asp or Glu will repel the phosphate towards a putative phosphate-binding pocket formed by the Arthropod-specific and Drosophila-specific mutations D981R and H994R, respectively. We labelled with asterisk (*) the mutations according to their positions in the DCR2 PAZ domain alignment, shown in Figure S20. W1013 was only identified in DCR1 proteins and can be found at position 116 of Figure S19. (B) Our analyses of K values revealed that PAZ domains typically accumulate mutations in three segments that form a solvent-exposed flat surface on the three-dimensional structure of AGO, DCR and DROSHA proteins. A distinctive groove at the opposite face of this surface was observed, adjacent to the canonical 3ʹ-overhang binding site of PAZ domains. Plants and lepidopterans display a distinctive positively-charged insertion in the N-terminal segment, suggesting their PAZ domains may bind RNA in a different orientation. (C) Comparison between the canonical phosphate-binding pocket of human DCR (blue ellipsis; PDB ID: 4NH6) and the putative phosphate-binding pocket we found in human DROSHA (green ellipsis; PDB ID: 5B16); this feature is also present in insects. Except for H982 (PAZ domain), all residues displayed in white colour refer to the Platform domain of human DCR. The insect equivalents to R778, R780 and R811 can be found at positions 21, 23 and 54 in Figure S23, while the equivalent to H982 can be found at position 85 in Figure S20. Except for R622 (Platform domain), all residues displayed in green colour refer to the DROSHA-specific insertion within the α2-α3 loop of the first Ribonuclease-III (RIIID) subunit of human DROSHA. The insect equivalents to R903, N905, F906 and R914 can be found at positions 15, 17, 18 and 26 in Figure S27, while the equivalent to R622 can be found at position 62 in Figure S24. The yellow ellipsis depicts the estimated location of Giardia lamblia’s putative phosphate-binding pocket. (D) Comparison between the canonical phosphate-binding pocket of human DCR (blue ellipsis; PDB ID: 4NH6) and the putative phosphate-binding pocket we found in G. lamblia DCR (glDCR; yellow ellipsis; PDB ID: 2QVW). The cavity forming the putative binding pocket is extremely well structured: two glutamate residues (E94 and E267 in glDCR) maintain four positively-charged residues coordinated around a central negatively-charged nucleus (R39, K270, R312 and R318). An additional histidine (H92 in glDCR) can potentially participate in the pocket insofar as E94 is repelled by an incoming phosphate. Except for R312 and R318 (RIIID-I subunit), all residues displayed in yellow colour refer to the Platform domain of glDCR. The green ellipsis depicts the estimated location of human DROSHA’s putative phosphate-binding pocket. Information regarding white-coloured residues is described in C. (E) Depiction of important features we identified in DROSHA proteins. The hydrophobic residues that comprise most of the hydrophobic groove are clustered into a single segment (residues 645–681), which is also conserved in insect DCR1 and DCR2 proteins (positions 81–112 in Figures S22 and S23); however, lepidopteran DCR1 and plant Dicer-like (DCL) proteins differ by displaying distinctive positively-charged residues in this region. Similar to what we observed for the PAZ domain, several mutation-prone segments of the Platform domain sequence are common to the DCR1, DCR2 and DROSHA proteins. Furthermore, we observed that these common mutation-prone segments cluster on the three-dimensional structure of the Platform domain to form a contiguous surface. The nature of this mutation-prone surface is unclear
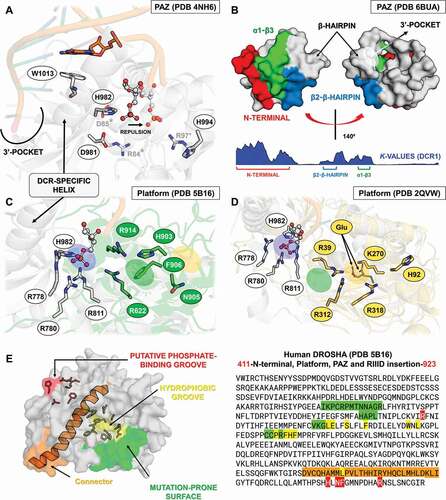
Figure 9. Structural and phylogenetic analysis of Ribonuclease III domain. (A) Maximum likelihood analysis of the two subunits (I and II) of Ribonuclease III domain (RIIID) present in the proteins DCR1, DCR2 and DROSHA from species belonging to the five insect orders (Coleoptera, Diptera, Hemiptera, Hymenoptera and Lepidoptera). The first subunit found in the DROSHA protein differs from the others, being then called RIIID-like. Each triangle represents an insect order, according to the colour legend presented, and it is proportional to the number of branches present. The outgroup (hidden) used was the RIIID domain from human DCR1 (PDB ID: 5ZAK) and the bootstrap values are represented by dark blue circles (minimum 70). (B-D) Superposition of the RIIID and RIIID-like domains from DCRs (B and C) and DROSHA (D) proteins, highlighting the main variability spots (α5-α6 loop in both RIIID-I and RIIID-II from DCR1-2, and RIIID-II from DROSHA, as well as α2-α3 loop in RIIID-like from DROSHA; see also Figures S25-S30). In (B), the species that represented each insect order were: Coleoptera: T. castaneum (TC001750); Diptera: D. melanogaster (FBpp0083717); Hemiptera: B. tabaci (Bta12886); Hymenoptera: A. melífera (GB44595); and Lepidoptera: M. sexta (Msex2.10734). In (C), the species that represented each insect order were: Coleoptera: T. castaneum (TC001108); Diptera: D. melanogaster (FBpp0086061); Hemiptera: B. tabaci (Bta10685); Hymenoptera: A. melífera (GB48923); and Lepidoptera: M. sexta (Msex2.04462). In (D), the species that represented each insect order were: Coleoptera: T. castaneum (TC016208); Diptera: D. melanogaster (FBpp0087926); Hemiptera: B. tabaci (Bta10972); Hymenoptera: A. melífera (GB49096); and Lepidoptera: M. sexta (Msex2.00504)
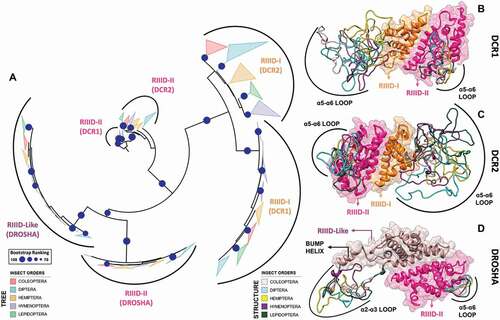
Figure 10. Variabilities within the Ribonuclease-III domain (RIIID). (A) Depiction of all the different features we found in insect RIIIDs; this was achieved by superposing the second RIIID subunit (in blue) of human DCR (PDB ID: 5ZAK) onto the first RIIID subunit (in green) of human DROSHA (PDB ID: 5B16). The Platform domain of human DROSHA was kept in the image (green transparency) to show how the Connector helix acts as surrogate for helix α1 in the first RIIID subunit of DCR and DROSHA proteins. The Bump helix is a unique feature of DROSHA proteins, which display a long insertion in the α2-α3 loop. The Loop helix is typically found in the α5-α6 loops of RIIIDs belonging to DCR proteins. The mutation-prone surface was identified in insects and is composed by the C-terminal regions of helices α3, α5 and α7. In human DROSHA, this region has been shown to bind the C-terminal tail of PASHA at two different positions, depending on which of the two RIIID subunits the binding event occurs. (B) Overview of RIIID features in the context of DCR proteins. The Loop helix from RIIID-II interacts with the Hel1 and Dicer Dimer domains. The N-terminal region flanking the Loop helix makes extensive contact with the α2-α3 loop of RIIID-II, while the flanking C-terminal region can potentially interact with the Hel2 subdomain when DCR is in the ATP-bound conformation, or with dsRNA being threaded through the Helicase domain. The α1 helix of RIIID-II is prone to accumulate mutations and located opposite to the catalytic sites; this region forms a solvent-exposed surface in-between the Hel1 domain and the rest of RIIID-II. In RIIID-I, a mutation-prone, solvent-exposed surface is formed by the C-terminal region of α2 and the unresolved region between α5 and the ‘Loop helix’. Just for illustrative purposes, a dsRNA molecule was modelled onto the structure of human DCR using the dsRNA from PDB 6BU9 as template
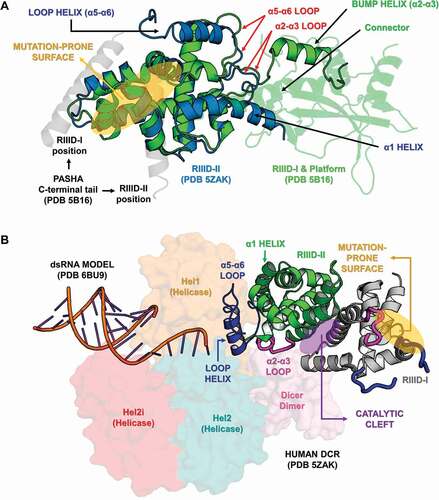
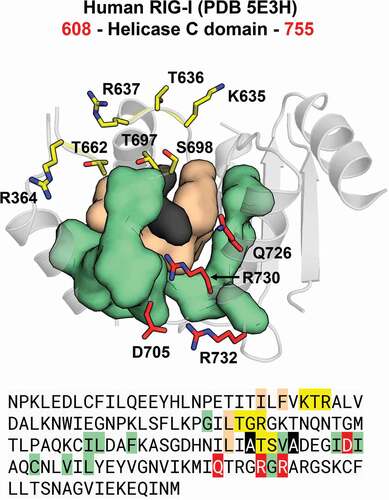
Figure 11. Structural and phylogenetic analysis of Helicase domain. (A) Maximum likelihood analysis of the complete Helicase domain present in the proteins DCR1 and DCR2 from species belonging to the five insect orders (Coleoptera, Diptera, Hemiptera, Hymenoptera and Lepidoptera). Each triangle represents an insect order, according to the colour legend presented, and it is proportional to the number of branches present. The outgroup (hidden) used was the Helicase domain from human DCR1 (PDB ID: 5ZAK) and the bootstrap values are represented by dark blue circles (minimum 70). (B and C) Superposition of the models from DCR Helicase domains, highlighting the main variability spots. Specifically in the DCR1 Helicase models (B), lepidopteran and dipteran-specific loops (β6-α7 and β13-α18 regions, respectively), as well as α14–β9 loop (identified in all insect orders) were highlighted (see also Figure S31). In (B), the species that represented each insect order were: Coleoptera: T. castaneum (TC001750); Diptera: D. melanogaster (FBpp0083717); Hemiptera: B. tabaci (Bta12886); Hymenoptera: A. melífera (GB44595); and Lepidoptera: M. sexta (Msex2.10734). In (C), the species that represented each insect order were: Coleoptera: T. castaneum (TC001108); Diptera: D. melanogaster (FBpp0086061); Hemiptera: B. tabaci (Bta10685); Hymenoptera: A. melífera (GB48923); and Lepidoptera: M. sexta (Msex2.04462). (D) Illustrative representation of Helicase domain from human RIG-I (PDB ID: 5E3H), where its four functional subdomains were highlighted: olive green – DEAD/ResIII (Hel1); red – Hel2i; dark blue – Helicase C (Hel2); and light brown – Pincer. RNA molecule is represented in cyan blue colour. The recognition sites of ATP hydrolysis and binding as well as RNA binding are represented by red and yellow circles, respectively
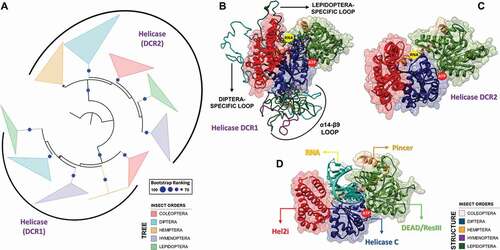
Figure 12. Communication hub for the ATP– and RNA-binding site in RIG-I-like helicases. A network of hydrophobic interactions is arranged around two main amino acid residues (in black). The first layer of hydrophobic residues to interact with the core residues is composed by four residues (in beige) that span motifs IV, IVa and V in insect DCR proteins (see Figures S31 and S32). The second layer is composed by eleven residues (in olive) that span motifs Va and VI, as well as a hitherto undescribed region which we designated as motif IVb. Together, these two layers coordinate the positioning of the ATP– and RNA-binding residues (in red and yellow, respectively). This coordination is important because for translocation and/or unwinding to occur on the dsRNA substrate, the ATP-binding event must communicate with the RNA-binding event (and vice-versa). In insect DCR proteins, the residues participating in this hub are also conserved, which suggests that a similar mechanism for the communication between the ATP – and RNA-binding sites may apply to viral and RNAi-related helicases (see blue, black, grey, red and yellow circles in Figures S31 and S32)