Figures & data
Figure 1. miRNA expression dynamics in the gut tissue posteclosion at the adult stage. (A) Top 10, most abundant Ae. aegypti miRNAs at 24 h PE, 72 h PE and 24 h PBM in the gut tissue. (B) Unsupervised hierarchical clustering (Pearson correlation and complete linkage) of mature miRNAs during posteclosion (PE) time phase; expression levels are indicated by averages of normalized expression (RPM) from three independent biological replicates of small RNA libraries at unique time points. (C) Expression trend lines of three clusters peaking at 24 h (early; clade II and VI), 48 h (mid; clade III), and 72 h (late; clade IV) PE. For each miRNA, expression profiles were converted to represent percentages of normalized reads at each time point. Averages were taken at each time point within clusters to display trend lines. Cluster colours are consistent with those in panel B
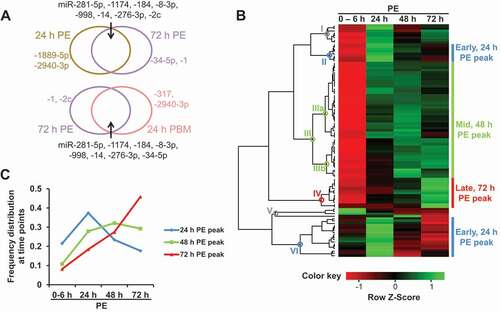
Figure 2. Differential expression of miRNAs in the gut at 72 h PE and 24 h PBM. List of differentially expressed miRNAs acquired with edgeR package (FDR<0.05), based on three independent biological replicates of small RNA libraries. The list was plotted with normalized expression (RPM) in each biological replicate
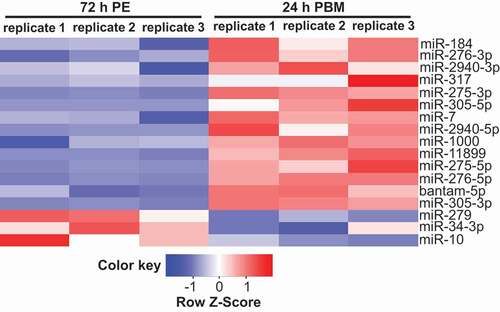
Figure 3. Met-mediated JH signalling modulates miRNA expression. Non-manipulated mosquitoes (WT) and those injected with luciferase gene dsRNA (iLuc) were treated as control groups. Relative expression levels of mature miRNAs, normalized to U6, were surveyed using qPCR in the gut tissue responsive to Met knockdown (A, 24 h PE peak; B, 72 h PE peak; and C, 48 h PE peak). Three independent biological replicates were performed, and statistical significance was calculated using unpaired t-tests (*P-value <0.05; **P-value <0.01). Data are presented as mean ± SEM. Colours are consistent with those of expression patterns in , C
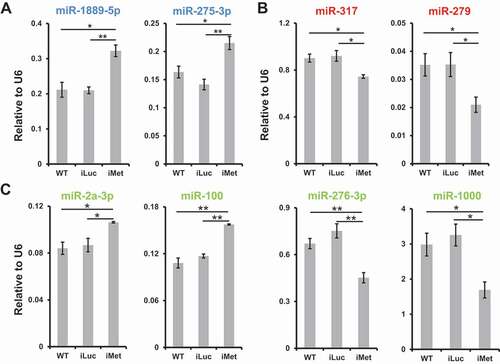
Figure 4. EcR-mediated 20E signalling modulates miRNA expression. Non-manipulated mosquitoes (WT) and those injected with luciferase gene dsRNA (iLuc) were treated as control groups. Relative expression levels of mature miRNAs, normalized to U6, were surveyed using qPCR in gut tissue responsive to EcR knockdown at 24 h PBM (A, upregulated miRNAs at 24 h PBM, listed in ; B, downregulated miRNAs at 24 h PBM, listed in and S2B). Three independent biological replicates were performed and statistical significance was calculated using unpaired t-tests (*P-value <0.05; **P-value <0.01). Data are presented as mean ± SEM
Figure 5. miR-281(−5p) is indispensable for the normal progression of blood digestion and gonadotrophic cycle. Non-manipulated mosquitoes (WT) and those injected with a scrambled antagomir (Ant-Scr) were treated as control groups. Statistical significance was calculated using unpaired t-tests (*P-value <0.05; **P-value <0.01). (A) Expression levels of miR-281 normalized to U6 were examined in female adult tissues of fat body (FB), ovary and gut at 72 h PE and 24 h PBM. (B-C) Expression levels of miR-281 normalized to U6 were examined at 72 h PE (B) and 24 h PBM (C) to confirm reduced expression due to the antagomir treatment. A randomly selected miRNA, miR-275-3p (B), was surveyed to affirm the specificity of the miR-281 antagomir. For illustration of panel B, means and SEMs are linearly scaled by treating average expression levels of WT as 1. (D) Digestive status was monitored by measuring haemoglobin (Hb) levels at 24 h PBM. Three to six fully engorged guts were homogenized per group in each biological replicate and three independent biological replicates were quantified. Results are illustrated as mean ± SD. (E) Follicle size was measured at 24 h PBM under the Leica M165 FC stereo microscope in groups of WT, Ant-Scr and Ant-281. In each group, one biological replicate consisted of readings from a minimum of 6 females and three independent biological replicates were performed. Data are presented as mean ± SEM. (F) Female fecundity was assessed by counting average number of eggs laid in WT, Ant-Scr and Ant-281 groups. In one biological replicate, eggs were counted from 15–20 females in each group, and a total of six independent biological replicates were performed per group. Data are presented as mean ± SD