Figures & data
Figure 1. The reporter constructs encode green fluorescent protein (sfGFP) along with malachite green RNA aptamer (MGapt) in the 3ʹ-UTR. The riboswitch performance (B) was compared with the expression of the control construct (A) in S30 extract and PURE cell-free systems
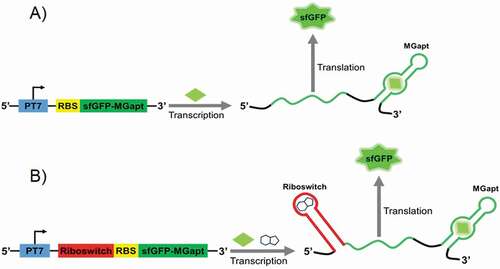
Figure 2. The kinetics of gene expression for the control construct in (A) PURE and (B) S30 extract cell-free systems at different concentration of DNA plasmids. The transcription was reported by synthesis of MGapt and translation was monitored with sfGFP production
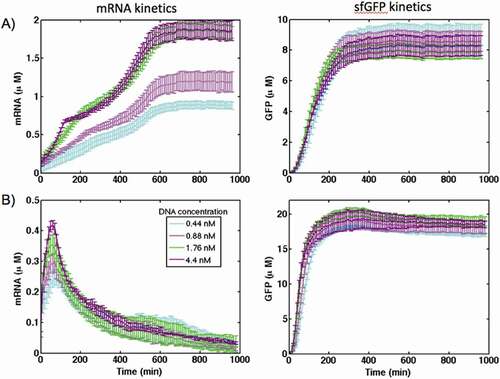
Figure 3. The kinetics of mRNA synthesis and sfGFP production for the theophylline riboswitch in comparison with the control construct in (A) PURE and (B) S30 extract cell-free systems at different concentration of theophylline. DNA template concentration is 1.76 nM
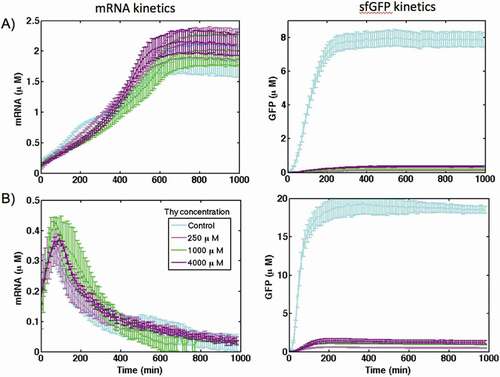
Figure 4. Comparison of mRNA level quantification for riboswitch in the ‘OFF’ and ‘ON’ states at selected time points in PURE and S30 extract using malachite green aptamer and qRT-PCR techniques
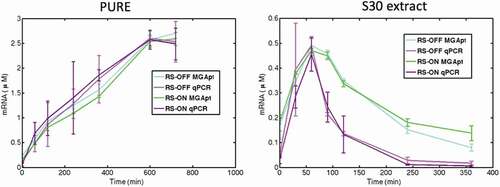
Figure 5. Expression of theophylline riboswitch mRNA transcripts in PURE system and S30 extract in the absence and presence of 2 mM theophylline. No riboswitch activation was observed. As a negative control, 2 mM theophylline was added to CFPS without the mRNA transcript
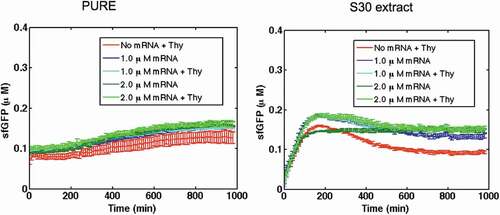
Figure 6. Kinetics of mRNA in ‘OFF’ and ‘ON’ states and sfGFP expression of theophylline riboswitch at different concentration of theophylline in PURE (A) and S30 extract (B) cell-free systems. Solid lines are modelling results and lines with error bars represent the experimental data
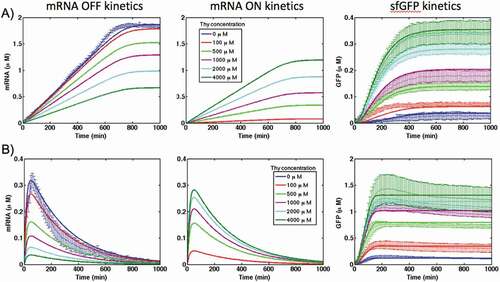
Figure 7. Dose response of theophylline riboswitch in PURE and E. coli extract cell-free system. Solid lines are modelling results and error bars represent the experimental data. Concentration of theophylline is shown on the logarithmic scale
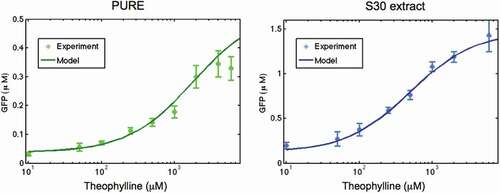
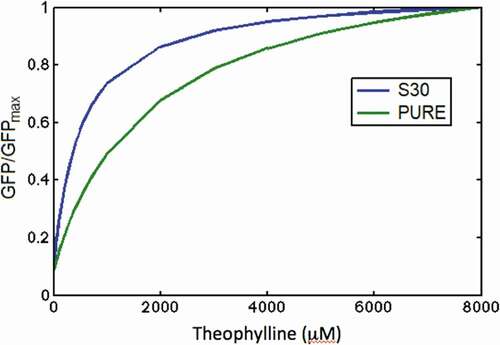
Figure 8. Comparison of dose response in PURE and S30 extract cell-free systems. Theophylline concentration is presented on the linear scale; sfGFP concentration is normalized to sfGFPmax