Figures & data
Figure 1. Splicing events and SMARTer Capture method (A) Alternative mRNAs result from exon skipping, selection of mutually exclusive exons, usage of alternative 5′ (donor) sites or alternative 3′ (acceptor) sites, and intron retention. (B) Workflow for the SMARTer Capture method
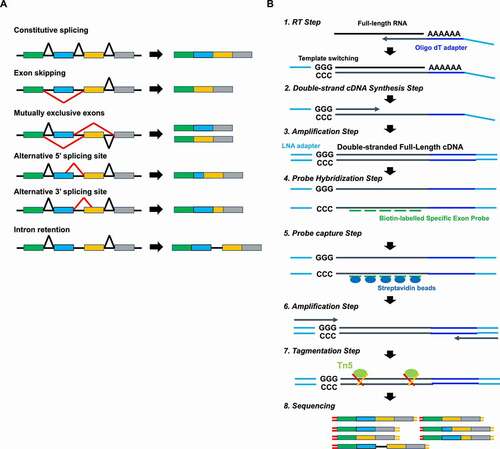
Figure 2. Comparison of SMARTer Sequencing and standard RNA-Seq (A) Mapped read number. (B) Percentage of mapped reads. (C) Number of expressed genes detected. (D) Scatter plot (log2 TPM (Transcripts per million)) of standard RNA-Seq (x-axis) and SMARTer (y-axis). Red spots indicate the differential expression genes (p < 0.05) (E) Gene body coverage. (F) The percentage in each region [CDS Exons, 5′UTR, 3′UTR, intron, TSS upstream (TSS up) and TES downstream (TES down)]. (G) Pie chart of each splicing event
![Figure 2. Comparison of SMARTer Sequencing and standard RNA-Seq (A) Mapped read number. (B) Percentage of mapped reads. (C) Number of expressed genes detected. (D) Scatter plot (log2 TPM (Transcripts per million)) of standard RNA-Seq (x-axis) and SMARTer (y-axis). Red spots indicate the differential expression genes (p < 0.05) (E) Gene body coverage. (F) The percentage in each region [CDS Exons, 5′UTR, 3′UTR, intron, TSS upstream (TSS up) and TES downstream (TES down)]. (G) Pie chart of each splicing event](/cms/asset/8b47c2dd-a34c-4cc4-9a89-83ed0172e153/krnb_a_1872961_f0002_oc.jpg)
Figure 3. Comparison of SMARTer and SMARTer Capture (A) Mapped read number. (B) Percentage of mapped reads. (C) Frequency of coverage. (D) The percentage of 0% coverage region and 100% coverage region. (E) The average depth in target regions. (F) Expression of Total and Target genes (TPM: transcripts per million). (G) Scatter plot (log2 TPM (Transcripts per million)) of SMARTer (x-axis) and SMARTer Capture (y-axis) in 113 target genes. (H) The percentage of detected and undetected genes. (I) The percentage of SMARTer Capture detected and undetected genes among those undetected by the SMARTer method. (J) The percentage in each region [CDS Exons, 5′UTR, 3′UTR, intron, TSS upstream (TSS up) and TES downstream (TES down)]. (K) Pie chart of each splice event
![Figure 3. Comparison of SMARTer and SMARTer Capture (A) Mapped read number. (B) Percentage of mapped reads. (C) Frequency of coverage. (D) The percentage of 0% coverage region and 100% coverage region. (E) The average depth in target regions. (F) Expression of Total and Target genes (TPM: transcripts per million). (G) Scatter plot (log2 TPM (Transcripts per million)) of SMARTer (x-axis) and SMARTer Capture (y-axis) in 113 target genes. (H) The percentage of detected and undetected genes. (I) The percentage of SMARTer Capture detected and undetected genes among those undetected by the SMARTer method. (J) The percentage in each region [CDS Exons, 5′UTR, 3′UTR, intron, TSS upstream (TSS up) and TES downstream (TES down)]. (K) Pie chart of each splice event](/cms/asset/ca76ee6d-4954-41ee-b5df-74fe9516a50e/krnb_a_1872961_f0003_oc.jpg)
Figure 4. Alternative splice event analysis (A) The ratio of detected and undetected splice events for each sample. The number in the bar indicates the number of genes. (B) The splice event number per event (exon skipping, multiple exon skipping, mutually exclusive exons, alternative 5′ splice site, and alternative 3′ splice site). (C) Transcripts per million (TPM) level of CD74, TP53, and FGFR3. (D, E, and F) Splice maps of CD74, TP53, and FGFGR3. Black arrows indicate non-specific genomic DNA amplification. (G) TPM of detected and undetected splice events by SMARTer (H) The percentage of genes at varying TPM for the standard and improved methods (I) The percentage of splice variants detected in CDS Exons, 5′UTR, 3′UTR, intron, TSS upstream (TSS up) and TES downstream (TES down) by SMARTer TPM. (J) Pie chart of each splicing event for each expression level of genes by SMARTer
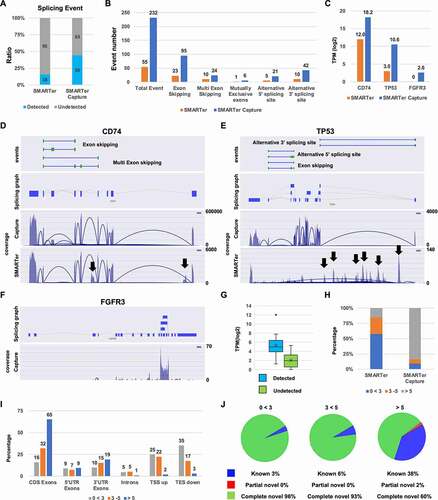
Figure 5. Read numbers (A) The total mapped read number for SMARTer, SMARTer Capture, and the 1/10, 1/100, and 1/1000 read extracted by Seqkit from SMARTer Capture. (B) The average depth of targeted regions for each sample. (C) The total number of splicing events for the targeted genes in each sample. (D) Splice event number per event (exon skipping, multiple exon skipping, mutually exclusive exons, alternative 5′ splice site, and alternative 3′ splice site) for each sample. (E) Scatter and correlation plots of the percent splicing in index (PSI) for each sample.pt?>