Figures & data
Figure 1. Characterization of SHOxi. (A) RNA-seq coverage plots of the assembled SHOxi transcript with data from [Citation9] under no challenge and oxidative stress conditions. (B) In vivo validation of SHOxi expression by Northern blot analysis. 50S rpo L30 was used as a loading control. (C) Genomic context of SHOxi. The inlet box is 50nt upstream of the transcription start site of SHOxi and marked are various conserved archaeal transcription motifs. (D) Multiple sequence and structural alignment of SHOxi and the sRNA homolog in H. gibbonsii. (E) Predicted secondary structure model (minimum free energy) of SHOxi. The colour indicates number of base pair types (red: 1, yellow: 2), hue shows sequence conservation of the base pair, and saturation indicates the structural conservation of the base pair. Putative interaction region highlighted in magenta
![Figure 1. Characterization of SHOxi. (A) RNA-seq coverage plots of the assembled SHOxi transcript with data from [Citation9] under no challenge and oxidative stress conditions. (B) In vivo validation of SHOxi expression by Northern blot analysis. 50S rpo L30 was used as a loading control. (C) Genomic context of SHOxi. The inlet box is 50nt upstream of the transcription start site of SHOxi and marked are various conserved archaeal transcription motifs. (D) Multiple sequence and structural alignment of SHOxi and the sRNA homolog in H. gibbonsii. (E) Predicted secondary structure model (minimum free energy) of SHOxi. The colour indicates number of base pair types (red: 1, yellow: 2), hue shows sequence conservation of the base pair, and saturation indicates the structural conservation of the base pair. Putative interaction region highlighted in magenta](/cms/asset/ec1b424c-8ff1-4ceb-91cb-61a38a5cd1e5/krnb_a_1874717_f0001_oc.jpg)
Figure 2. Phenotypic characterization of ΔSHOxi. (A) Survival of wild type and ΔSHOxi under oxidative stress. (B) Rescuing survival by overexpression of SHOxi in a ΔSHOxi mutant. The negative control was ΔSHOxi with a vector without insert (Δ + empty vector), and the positive control was the wild type with a vector without insert (WT + empty vector). SHOxi was overexpressed on the plasmid pTA1300 under a tryptophan inducible promoter in a ΔSHOxi background. In both (A) and (B), survival was calculated as the ratio of colony forming units (CFU) between no challenge and oxidative stress conditions (± 2 mM H2O2, 1 h exposure). (C) Western blot analysis of carbonyl groups found on proteins, a proxy for oxidative damage. Samples were the wild type under no challenge conditions (0 mM H2O2), the wild type exposed to 2 mM H2O2 (80% survival), and ΔSHOxi exposed to 2 mM H2O2. A loading control gel is provided below the plot. (D) Quantification of (C) with corresponding legends. Ratio of intensity were between the loading control gel and the protein carbonyl Western blot
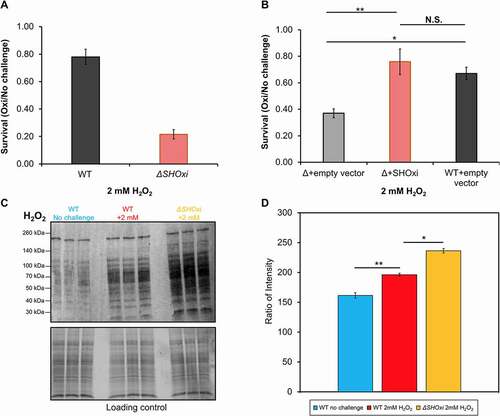
Figure 3. Identification of potential targets of SHOxi. (A) Northern blot analysis confirming the presence SHOxi transcripts in WT and absence in ΔSHOxi. (B) Scatterplot of differentially expressed genes in the absence of SHOxi (fold-change between ΔSHOxi +H2O2 and WT +H2O2) compared to the wild type under oxidative stress (fold-change between +H2O2 and no challenge). (C) Predicted hybridization plot of the top 25 most probable interactions in the entire transcriptome of H. volcanii. Black lines represent putative mRNA targets and blue lines indicate the predicted interaction region with SHOxi. The base-pair location on the SHOxi sequence is indicated on the x-axis. The curve above represent the regions of SHOxi with the most predicted interactions
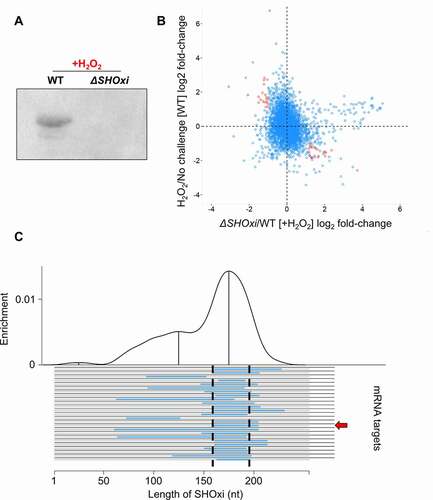
Figure 4. Regulation of malic enzyme mRNA by SHOxi. (A) Predicted interaction between malic enzyme mRNA (target) and SHOxi (query). Numbering of the malic enzyme mRNA start at the ATG. Wobble base bonds indicated by two dots between hybridizing nucleotides. (B) Bar plot of log2 fold-change of malic enzyme mRNA from RNA-seq, qPCR, and SHOxi overexpression, and translation efficiency of malic enzyme mRNA (Ribo-seq)
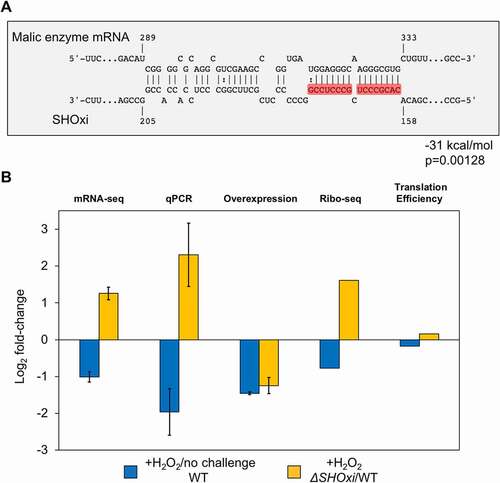
Figure 5. In vivo validation of direct interaction between SHOxi-malic enzyme mRNA. (A) Schematic of mutations in the ‘seed’ binding region of SHOxi with malic enzyme mRNA. (B) Northern blot of SHOxi transcript levels expressed ectopically under a tryptophan promoter. -Trp is without tryptophan, and +Trp is with 2 mM tryptophan for 1 h. 5S rRNA is a loading control. (C) qRT-PCR of malic enzyme mRNA levels in various SHOxi mutants (from A) calculated as the fold change relative to overexpression of the WT SHOxi
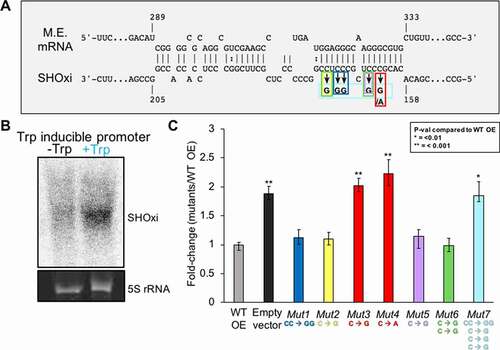
Figure 6. Destabilization of malic enzyme mRNA. (A) Schematic of the experimental approach to measure the half-life of malic enzyme mRNA in response to SHOxi. 30 min after SHOxi induction, with H2O2 or via an inducible tryptophan promoter, transcription was shut off by the addition of 100 µg/ml actinomycin D and the level of malic enzyme mRNA was analysed by qRT-PCR at several time points. (B) qRT-PCR of malic enzyme mRNA levels over time after addition of actinomycin D. Log2 fold changes were calculated between the WT and ΔSHOxi with 2 mM H2O2. (C) qRT-PCR of the house keeping gene surface protein mRNA levels in the same conditions as in (B). (D) qRT-PCR of malic enzyme mRNA levels after addition of actinomycin D and the induction with 2 mM tryptophan of a complementation in trans of the ΔSHOxi mutant, under no challenge conditions. Log2 fold changes were calculated between the SHOxi overexpression construct and the vector without insert in a ΔSHOxi background. (E) qRT-PCR of malic enzyme mRNA levels in the same conditions as in (D) but with the overexpression of the disruptive SHOxi mutant Mut 7 from Fig. 4–5 C.
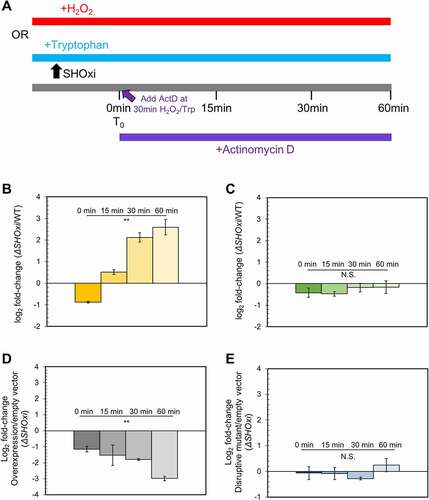
Figure 7. Measurements of cellular dinucleotides using a luciferase-based assay. Ratios of NAD+/NADH and NADP+/NADPH were calculated to determine the relative abundance
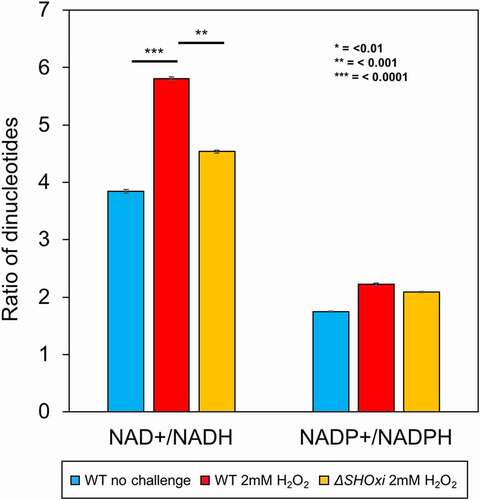
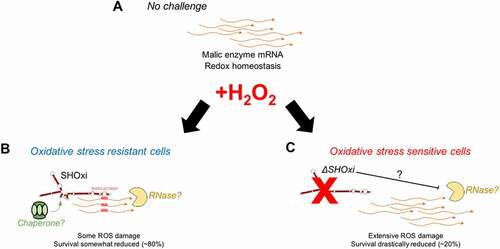
Figure 8. A model for the posttranscriptional regulation of malic enzyme mRNA by SHOxi. (A) Wild type no challenge conditions. (B) Wild type under oxidative stress conditions (+2 mM H2O2, 80% survival). (C) A knockout of SHOxi (ΔSHOxi) under the same conditions as (B)