2,548
Views
5
CrossRef citations to date
0
Altmetric
Brief Communication

Ribosome profiling analysis of human skeletal muscle identifies reduced translation of mitochondrial proteins with age

, , , &
Pages 1555-1559 | Received 15 Aug 2020, Accepted 09 Jan 2021, Published online: 21 Jan 2021

Figures & data

Figure 1. Workflow of ribosome profiling experiment and ribosome occupancy analysis. (A) Bergström needle biopsies from vastus lateralis muscles were obtained from healthy adults. Samples were collected from three middle-aged and two old individuals, as shown. Ribosome profiling and Total RNA libraries (RiboSeq and RNASeq, respectively) were prepared. The bioinformatic workflow for the ribosome profiling data filtered out contaminating non-coding RNA sequences, in particular rRNAs, tRNAs, snRNAs, and snoRNAs, and then aligned the RiboSeq reads to the known transcriptome. In parallel, Total RNASeq data was aligned to the transcriptome. Finally, translational efficiency (TE) was calculated for each known transcript by finding the ratio RiboSeq/RNASeq. TE was then compared between muscle from younger and older participants. (B) Overall distributions of ribosome profiling and Total RNA sequencing data. The scatterplots show, for each known transcript, the normalized level of reads from the ribosome profiling libraries in transcripts per million (TPM) in the y-axes (RiboSeqTPM) and the RNA sequencing in the x-axes (RNASeqTPM). The y-axis represents the level of ribosome occupancy and hence translation level, while the x-axis is a representation of the steady-state levels of mRNAs in the cell (the balance between mRNA transcription and mRNA degradation). Highlighted are the transcripts whose translation was significantly different between younger and older individuals: red dots represent mitochondrial transcripts, which cluster together and were decreased with age, green dots represent mRNAs showing decreasing translation in older muscle, and blue represent mRNAs showing increased translation in older muscle. Descriptions of significantly changed transcripts are found in

Figure 1. Workflow of ribosome profiling experiment and ribosome occupancy analysis. (A) Bergström needle biopsies from vastus lateralis muscles were obtained from healthy adults. Samples were collected from three middle-aged and two old individuals, as shown. Ribosome profiling and Total RNA libraries (RiboSeq and RNASeq, respectively) were prepared. The bioinformatic workflow for the ribosome profiling data filtered out contaminating non-coding RNA sequences, in particular rRNAs, tRNAs, snRNAs, and snoRNAs, and then aligned the RiboSeq reads to the known transcriptome. In parallel, Total RNASeq data was aligned to the transcriptome. Finally, translational efficiency (TE) was calculated for each known transcript by finding the ratio RiboSeq/RNASeq. TE was then compared between muscle from younger and older participants. (B) Overall distributions of ribosome profiling and Total RNA sequencing data. The scatterplots show, for each known transcript, the normalized level of reads from the ribosome profiling libraries in transcripts per million (TPM) in the y-axes (RiboSeqTPM) and the RNA sequencing in the x-axes (RNASeqTPM). The y-axis represents the level of ribosome occupancy and hence translation level, while the x-axis is a representation of the steady-state levels of mRNAs in the cell (the balance between mRNA transcription and mRNA degradation). Highlighted are the transcripts whose translation was significantly different between younger and older individuals: red dots represent mitochondrial transcripts, which cluster together and were decreased with age, green dots represent mRNAs showing decreasing translation in older muscle, and blue represent mRNAs showing increased translation in older muscle. Descriptions of significantly changed transcripts are found in Table 1

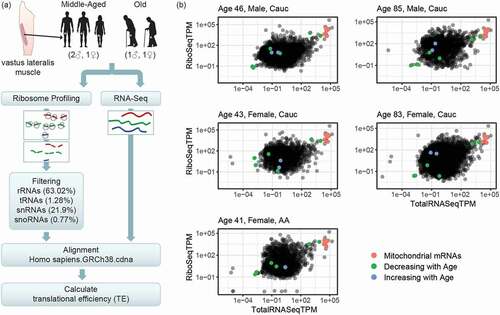
Table 1. Transcripts with translational efficiency significantly different between age groups. Negative fold changes indicate lower translation with older age and, viceversa, positive fold changes indicate higher translation with older age. Significance was tested using a Wald test with Benjamini-Hochberg adjustment

Supplemental material

Supplemental Material

Download Zip (225 KB)

Data availability statement

Raw RNASeq datasets from all samples, both RiboSeq and TotalRNASeq, are openly available in NCBI GEO at www.ncbi.nlm.nih.gov/geo with accession number GSE152558.25

Reprints and Corporate Permissions

Please note: Selecting permissions does not provide access to the full text of the article, please see our help page How do I view content?

To request a reprint or corporate permissions for this article, please click on the relevant link below:

Academic Permissions

Please note: Selecting permissions does not provide access to the full text of the article, please see our help page How do I view content?

Obtain permissions instantly via Rightslink by clicking on the button below:

If you are unable to obtain permissions via Rightslink, please complete and submit this Permissions form. For more information, please visit our Permissions help page.