Figures & data
Figure 1. Unmodified 2D and 3D structures. For the A) duplex and B) hairpin, analogous regions are highlighted in magenta and the experimentally probed base pair is denoted with a blue arrow. Nucleotides are numbered from 5ʹ to 3ʹ ends
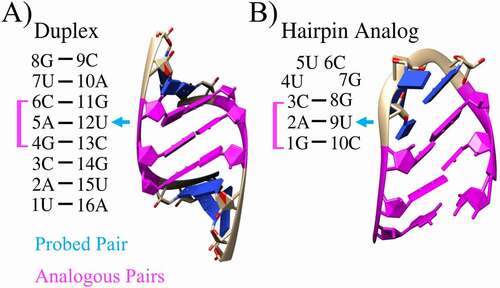
Figure 2. A thermodynamic cycle formed by the states indicated by red arrows. In order to separate the electrostatic and Lennard-Jones (LJ) contributions to the free energy change, we use three main steps to go from the WT to the modified states. The first step, labelled ‘Discharge’, removes all charge from the atoms in the starting residue. The blue residues are electrically neutral WT residues. The second step, labelled ‘LJ’, replaces atoms and bonds in the WT residue with atoms and bonds from the modified residue. Because the vanishing and appearing atoms are all electrically neutral in this step, the LJ potential is the contributor to the free energy change. The green residues are electrically neutral, modified residues. The third step, labelled ‘Charge’, reintroduces charge to the modified residue to bring us to the final, modified state. The red residues represent the electrically charged, modified residues. These steps must be done for both the duplex and reference (single-stranded) states in order to calculate the relative free energy change due to modification ∆∆G
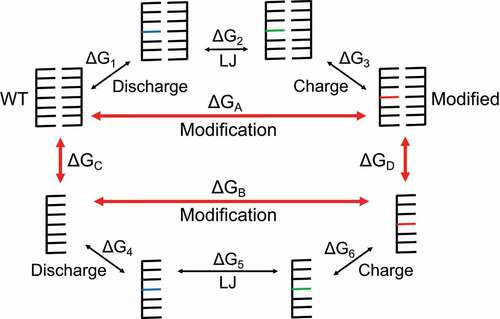
Figure 3. Calculated relative free energy changes using TI-Trapezoid. Experimental [Citation33] (calculated) results and error bars are shown in black (red). The results for twice-perturbed cases are the average of the results from the modify-then-mutate and the mutate-then-modify alchemical paths. Estimates from applying the Turner rules are shown in blue [Citation73]
![Figure 3. Calculated relative free energy changes using TI-Trapezoid. Experimental [Citation33] (calculated) results and error bars are shown in black (red). The results for twice-perturbed cases are the average of the results from the modify-then-mutate and the mutate-then-modify alchemical paths. Estimates from applying the Turner rules are shown in blue [Citation73]](/cms/asset/67177dc3-0698-4a79-8d11-66b9526f68a1/krnb_a_1882179_f0003_oc.jpg)
Figure 4. Experimental [Citation33] and calculated relative free energy changes due to modification ∆∆G. For the eight-base pair duplex, experimentally determined free energies calculated from two-state curve fits, van’t Hoff linear plots, and averages between the two-state fit and van’t Hoff fit are labelled ‘2-state fit’, ‘van’t Hoff’, and ‘Exp. average’, respectively. The values for ∆∆G calculated from the RMSD/E2E 2D PMFs of the hairpin analogue are labelled ‘Calc. from PMF’. Descriptive identifiers are provided to describe modifications and/or mutations (see ): for example, ‘m6A-U’ represents the modification of 2A (5A) to m6A in the simulated hairpin (experimental duplex), maintaining the canonical base pair with 9 U (12 U). Likewise, ‘A-C’ represents the hairpin (duplex) mutation of 9 U (12 U) to C. All hairpin (duplex) mutations were imposed on 9 U (12 U). The grey line indicates the free energy plateau, where the hairpin becomes completely destabilized. Experimental error bars are shown with respect to the experimental average. Estimates from applying the Turner rules are shown in blue
![Figure 4. Experimental [Citation33] and calculated relative free energy changes due to modification ∆∆G. For the eight-base pair duplex, experimentally determined free energies calculated from two-state curve fits, van’t Hoff linear plots, and averages between the two-state fit and van’t Hoff fit are labelled ‘2-state fit’, ‘van’t Hoff’, and ‘Exp. average’, respectively. The values for ∆∆G calculated from the RMSD/E2E 2D PMFs of the hairpin analogue are labelled ‘Calc. from PMF’. Descriptive identifiers are provided to describe modifications and/or mutations (see Fig. 1): for example, ‘m6A-U’ represents the modification of 2A (5A) to m6A in the simulated hairpin (experimental duplex), maintaining the canonical base pair with 9 U (12 U). Likewise, ‘A-C’ represents the hairpin (duplex) mutation of 9 U (12 U) to C. All hairpin (duplex) mutations were imposed on 9 U (12 U). The grey line indicates the free energy plateau, where the hairpin becomes completely destabilized. Experimental error bars are shown with respect to the experimental average. Estimates from applying the Turner rules are shown in blue](/cms/asset/53a7215f-a896-4ac0-9a9d-610375ebb6ee/krnb_a_1882179_f0004_oc.jpg)
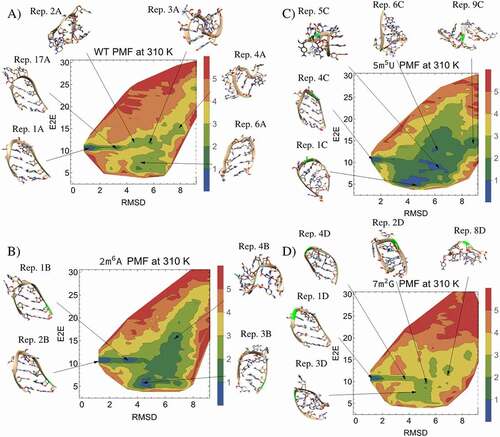
Figure 5. 2D PMFs and representative frames from hairpin TREMD simulations. The representative frames and PMFs for the A) WT B) modification of 2A to m6A (2m6A), C) modification of 5 U to m5U (5m5U), D) modification of 7 G to m2G (7m2G) are shown along the end-to-end distance (E2E) and RMSD reaction coordinates. Modified carbons and ribbons in the representative frames are highlighted in green, and the figure legends colour code the energy in kcal/mol