Figures & data
Figure 1. Structure of PNA-CPP probes. Left to right: fluorophore (‘label’), PNA-sequence and cell penetrating peptide (‘peptide’) are specified. FAM = 5/6-fluorescein, B = β-alanine, X = 6-aminohexanoic acid (Ahx), scr = scrambled. – = none
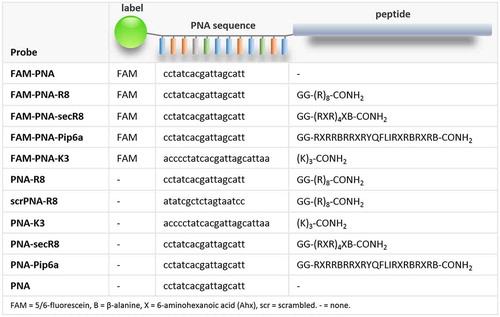
Figure 2. PNA delivery into human PBMCs via different peptide moieties. A) Anti-miR-155 PNAs were coupled to CPPs and FAM, and their delivery into human peripheral blood-derived mononuclear cells (PBMCs) was studied. Cells were counterstained with CD14 (monocyte/macrophage), CD66b (granulocyte), CD19 (B-cell) and CD4 (T-cell) specific antibodies. B) FACS analysis of human PBMCs. Top left: Forward-/Sideward-Scatter plot of untreated PBMCs. Bottom left: qRT-PCR analysis (Row Z-scores, colour-coded according to legend) of indicated marker expression in flow-sorted cell populations, using CD14-, CD66b-, CD19- or CD4-specific antibodies. Middle and right: Same cells as top left, but counterstained with subpopulation markers introduced above. Predominant area occupied by the respective subpopulations is indicated. Cells positive for the indicated markers are highlighted in blue. C) Left: total percentage of FAM-positive PBMCs upon challenge with indicated FAM-PNA-constructs (200 nM) or DMSO. Right: same as left, but for myeloid (CD14+/CD66b+) and lymphoid (CD19+/CD14+) subpopulations. D) Representative scatter plots of PBMCs treated with FAM-labelled control or PNA-R8. FAM-positive populations highlighted in green. Differences between groups of samples were evaluated by 1way-ANOVA with multiple comparisons (* = P-value ≤ 0.05, ** = P-value ≤ 0.01). Error bars indicate standard deviations, based on ≥ 3 independent experimental replicates
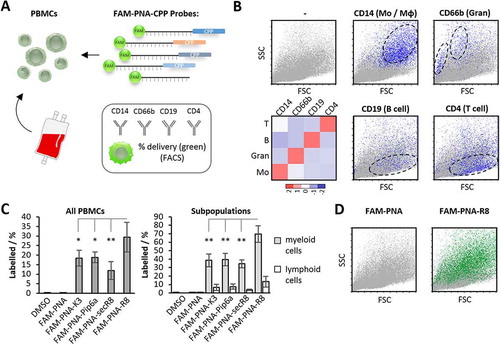
Figure 3. PNA delivery into human blood-derived macrophages. A) Anti-miR-155 PNAs, coupled to CPPs and to FAM, were applied to CD14+ monocyte derived macrophages to study their intracellular delivery and cytotoxicity. B) Geo-median fluorescence intensity (Geo-MFI) fold-change of macrophages after treatment with the indicated FAM-PNA constructs and concentrations, compared to background fluorescence. C) Same as B), but with percentage of labelled macrophages. D) Cytotoxicity of PNA-R8 and scrPNA-R8 as well as R8 towards macrophages at indicated concentrations. Viability was assessed after 72 h employing the resazurin cell viability assay. Error bars indicate standard deviations, based on ≥ 3 independent experimental replicates
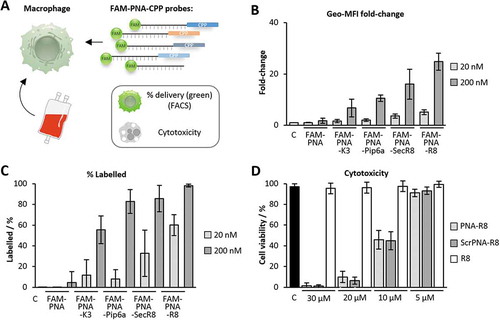
Figure 4. Fluorescence microscopy of PNA-treated blood-derived macrophages. A) Representative FACS analysis of macrophages treated with 200 nM anti-miR-155 PNA not coupled to R8 (top) or coupled to R8 (bottom). Dashed line separates background from FAM-fluorescence. B) Representative fluorescence microscopy pictures showing macrophages left untreated or treated for 24 h with 200 nM FAM-labelled, R8-CPP coupled anti-miR-155 PNA (FAM-PNA-R8). Nuclei counterstained with DAPI. DIC = differential interference contrast images. Scale-bar: 20 µm
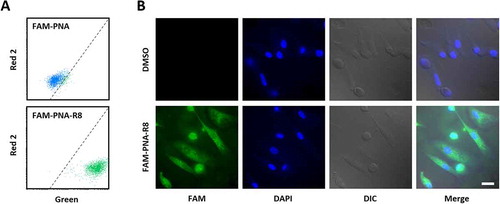
Figure 5. RNA-seq analysis of microRNA-155 knockout U937 macrophages. A) Schematic representation of experimental setup. PMA-differentiated U937 cells were transfected with control or microRNA-155 KO CRISPR constructs and clonal populations were raised, treated with 100 ng/mL LPS for 4 h or left untreated and subjected to RNA-seq analysis. B) Northern blot analysis of microRNA-155 and −17 expression in 4 h and 16 h LPS- or control-treated wild-type (WT) and knockout (KO) U937 macrophages. C) Cumulative density fraction analysis of microRNA-155 7-mer target RNA expression compared to random 7-mer RNAs, in two RNA-seq replicates of microRNA-155 KO versus WT cells. D) Heatmap representation of the fold-changes (over base-mean) of microRNA-155 3ʹ UTR target-site containing mRNAs elevated ≥ 1.5 fold in microRNA-155 KO compared to WT U937 macrophages. Two RNA-seq replicates. MyD88 and TAB2 mRNA are indicated. E) Schematic representation of the TLR4 signalling pathway with microRNA-155 feedback through MyD88 and TAB2 targeting. F) MyD88/NFκB target mRNA expression in microRNA-155 knockout compared to wild-type U937 macrophages. Two RNA-seq replicates shown
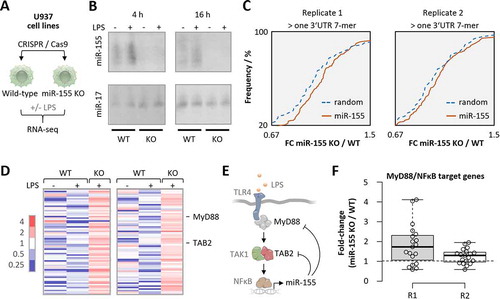
Figure 6. RNA-seq analysis of blood-derived macrophages treated with microRNA-155 inhibitors. A) Schematic representation of experimental setup. Blood-derived macrophages were treated with K3- and R8-coupled PNAs (200 nM) and subjected to LPS-treatment (100 ng/mL for 4 h) and RNA-seq analysis. B) qRT-PCR analysis of IL1β expression in LPS-treated macrophages compared to mock-treatment. C) Comparison of the expression of KO-confirmed microRNA-155 targets (from ) in blood-derived macrophages treated with indicated PNA inhibitors. Two RNA-seq replicates are shown, with fold-changes compared to base-mean. D) Heatmap showing RNA-seq-determined mRNA fold-changes ≥ 1.5-fold in microRNA-155 KO and ≥ 1.2-fold in R8 inhibitor-treated cells. Fold-changes colour-coded as indicated to the left. MyD88 and TAB2 mRNAs highlighted. E) Enriched KEGG pathways and corresponding P-values associated with the mRNAs from D). F) RNA-seq determined fold-changes (compared to base-mean) of MyD88 and TAB2 expression in microRNA-155 KO and PNA inhibitor treated macrophages. Differences between groups of samples were evaluated by 1way-ANOVA with multiple comparisons. P-values ≤ 0.05 are shown
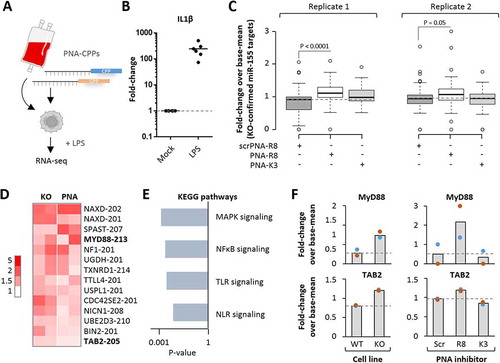
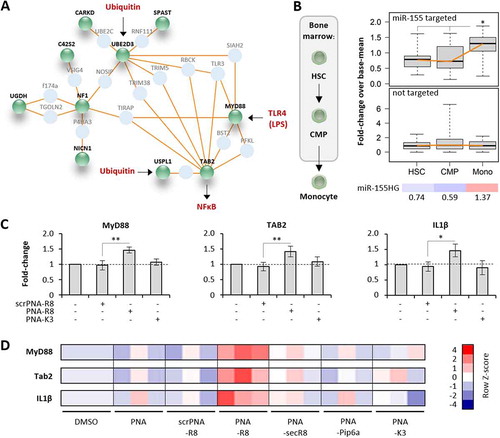
Figure 7. Verification and comparison of microRNA-155 inhibitory activity of PNA-CPPs. A) Induced network plot with proteins encoded by microRNA-155-supressed mRNAs from Fig. 6D (green) and their connecting interactors (light blue). Physiological inputs of this network in the form of TLR4-agonists and cellular ubiquitin and output in the form of NFκB-activation are shown in red. B) Left: schematic illustration of haematopoietic stem cell (HSC) differentiation to common myeloid precursors (CMP) and monocytes (Mono) in the bone marrow niche. Right top: base-mean fold-changes of microRNA-155 targeted mRNAs from A) in HSC, CMP and Mono (significance in Mono vs HSC and Mono vs CMP, respectively). Right middle: same as top, but with mRNAs not supressed by microRNA-155. Right bottom: Base-mean fold-changes (colour-coded) of microRNA-155 host-gene (HG) expression in HSC, CMP and Mono. C) qRT-PCR analysis of MyD88, TAB2 and IL1β mRNA expression in primary human blood-derived macrophages, treated with 200 nM of the indicated PNAs or left untreated (solvent control) for 24 h. D) Same as C, but showing results for all anti-miR-155 PNA constructs, unconjugated, or conjugated to R8 (scrambled (scr) and anti-miR-155), secR8, Pip6a, K3. Heatmap shows colour-coded Row Z-scores of three experimental replicates per condition. Differences between groups of samples were evaluated by 1way-ANOVA with multiple comparisons (* = P-value ≤ 0.05, ** = P-value ≤ 0.01). Error bars indicate standard deviations, based on ≥ 3 independent experimental replicates